Pi Coin cooled off a bit yesterday after its big breakout earlier this week. The price had soared past the $1.30 mark but has since pulled back to around $0.90, dropping over 30% on the day. Trading volume also dipped by 11%, which suggests some traders were locking in profits and momentum took a hit.
Still, the bigger picture hasn’t changed much. Pi Network price is holding above the old downtrend line it broke through earlier this month, and most indicators are still leaning bullish. The key question now is whether Pi Coin can push above the $1.00 to $1.10 zone. If it holds, the uptrend might still have legs. If it breaks, things could get choppy again.
What you'll learn 👉
What the Pi Coin Chart Is Showing
The daily chart still shows a classic breakout-retest setup. After trading in a long downtrend for months, Pi Coin price broke through the descending resistance line in early May and surged past $1.30. The rally was supported by multiple strong green candles, showing increased demand and momentum.
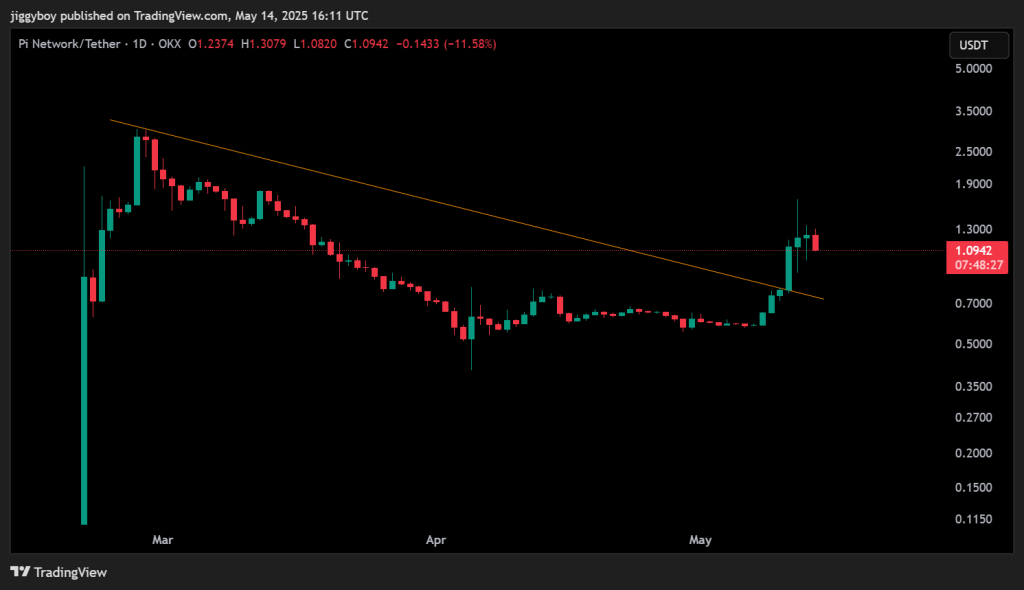
Now, the price is hovering just above the breakout area. The recent red candle with a long upper wick suggests rejection near $1.30 and hints of selling pressure. If bulls can defend the $0.90 range, the pullback may simply be a healthy pause before the next move higher. A break below this level, however, could open the door to a decline toward the $0.75 zone.
Read Also: Chainlink (LINK) Gearing Up for a Rally as Analyst Maps Out Next Big Target
Technical Indicators (Daily Timeframe)
| Indicator | Value | Interpretation |
| 📈 RSI (14) | 72.11 | Overbought, but still showing strength |
| 🔥 MACD (12,26) | 0.122 | Bullish crossover, upward momentum |
| 🌀 CCI (14) | 142.57 | Overbought zone, trend continuation likely |
| 💪 Ultimate Oscillator | 56.92 | Mild bullish pressure |
| 🚀 ROC | 83.49 | Strong momentum, potential cooldown |
| 🐂 Bull/Bear Power | +0.6283 | Bulls still in control |
Indicator Analysis (Textual)
RSI and CCI are above typical thresholds, signaling strong momentum but also suggesting that a temporary pullback may be needed. MACD continues to show a bullish crossover, supporting the idea that the trend has not yet reversed.
The ROC remains very high, indicating rapid price acceleration, which can often lead to a short cooling-off period. Bull/Bear Power also favors buyers, though the advantage has weakened slightly.
Pi Coin Price Forecast for Today (May 15)
1. Pessimistic Case
- Target: $0.75 – $0.80
- If selling pressure increases and $0.90 fails to hold, Pi Coin price could drop to retest its previous consolidation zone. This would mark a full retrace of the breakout move.
2. Realistic Case
- Target: $0.80 – $0.95
- A sideways consolidation just above the breakout area remains likely. Traders may stay cautious, waiting for volume to return before making directional bets.
3. Optimistic Case
- Target: $1.00 – $1.05
- If bulls defend the $0.90 zone and volume picks up, Pi Coin price may retest $1.00 and potentially break higher. A strong push past $1.10 could lead to fresh short-term highs.
What We Got Right Yesterday
In our May 14 prediction, we anticipated that Pi Coin would trade within the $1.18–$1.35 range, with a possible breakout depending on volume and support strength at $1.05.
While the price failed to hold above $1.18, our warning about a possible dip toward $1.05 played out accurately. The indicators suggested a pullback was due, and the retracement confirmed that scenario while keeping the broader trend structure alive.
Subscribe to our YouTube channel for daily crypto updates, market insights, and expert analysis.

We recommend eToro
Wide range of assets: cryptocurrencies alongside other investment products such as stocks and ETFs.
Copy trading: allows users to copy the trades of leading traders, for free.
User-friendly: eToro’s web-based platform and mobile app are user-friendly and easy to navigate.