After predicting correctly that Pi Coin price might test the $0.92 zone yesterday, this is exactly what we are seeing today. It’s down around 2% today and 21% in the last 7 days.
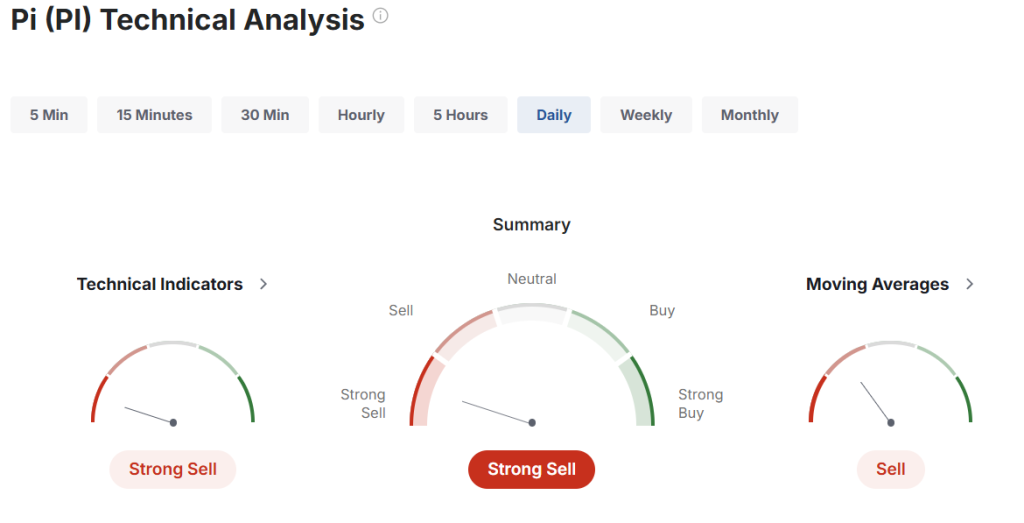
This is a downtrend we predicted a few weeks back. So, where could Pi Coin price be headed today? As usual, let’s look at some technicals on a daily timeframe.
What you'll learn 👉
Technical Indicators Analysis
The Relative Strength Index (RSI) provides insights into whether an asset is potentially overbought or oversold. With a current reading of 28.605, Pi Coin is showing signs of being in oversold territory. When the RSI drops below 30, it typically suggests that sellers have been pushing the price down aggressively, and the asset might be due for a potential price rebound or period of stabilization.
The Moving Average Convergence Divergence (MACD) indicates momentum and potential trend changes. At 0.074, the MACD indicates a very slight positive momentum, but it’s so close to zero that it suggests the market is currently in a state of uncertainty. This minimal positive value means that short-term price movements are just barely above the longer-term trend.
The Commodity Channel Index (CCI) at -96.6786 reveals slightly bearish pressure in the market. When the CCI drops below -100, it typically indicates that the price has fallen a lot below its average historical price,. This results in strong selling activity and potential market weakness.
The Ultimate Oscillator reading of 40.269 further confirms the market’s current fragility. Values below 50 typically point to limited buying interest and suggest that the downward price momentum might continue in the near term.
The Rate of Change (ROC) at -35.372 provides clear evidence of recent price decline. This steep negative value indicates that the price has dropped significantly compared to its recent historical levels. This indicator also points to the bearish sentiment in the market.
Lastly, the Bull/Bear Power at -0.4257 shows that bearish forces are currently dominating the market. This negative value suggests that sellers are more active than buyers, putting additional downward pressure on the cryptocurrency’s price.
Pi community apps that have complied with Ecosystem listing guidelines and completed PiNet migration by May 28th, 2025, can secure their domains without bidding, subject to certain requirements and restrictions.
Pi Coin Price Prediction
Based on the current technical indicators, Pi Coin is showing significant bearish signals.
Bearish Scenario: If the current trend continues, Pi Coin could potentially drop to the $0.70-$0.75 support zone. The oversold RSI and strongly negative CCI suggest continued downward pressure.
Bullish Scenario: A potential price recovery could occur if the coin finds support at the $0.90 level. A bounce back might happen if buying volume increases and we might see a retest of $1.00 – 1.10 range.
Today’s Prediction: Given the current indicators, we anticipate Pi Coin will likely trade in the $0.85-$0.95 range, with a slight bias towards the lower end of this spectrum.
Read also: Pi Coin Price Collapse Might Be Your Signal to Buy These Hidden Crypto Gems
Subscribe to our YouTube channel for daily crypto updates, market insights, and expert analysis.

We recommend eToro
Wide range of assets: cryptocurrencies alongside other investment products such as stocks and ETFs.
Copy trading: allows users to copy the trades of leading traders, for free.
User-friendly: eToro’s web-based platform and mobile app are user-friendly and easy to navigate.