
Pi Coin remains under pressure following a failed breakout attempt earlier this week. The price has returned to a narrow consolidation range just above a key support zone, with no strong momentum on either side. Trading volume has dropped sharply, and all major hourly indicators remain tilted toward the downside.
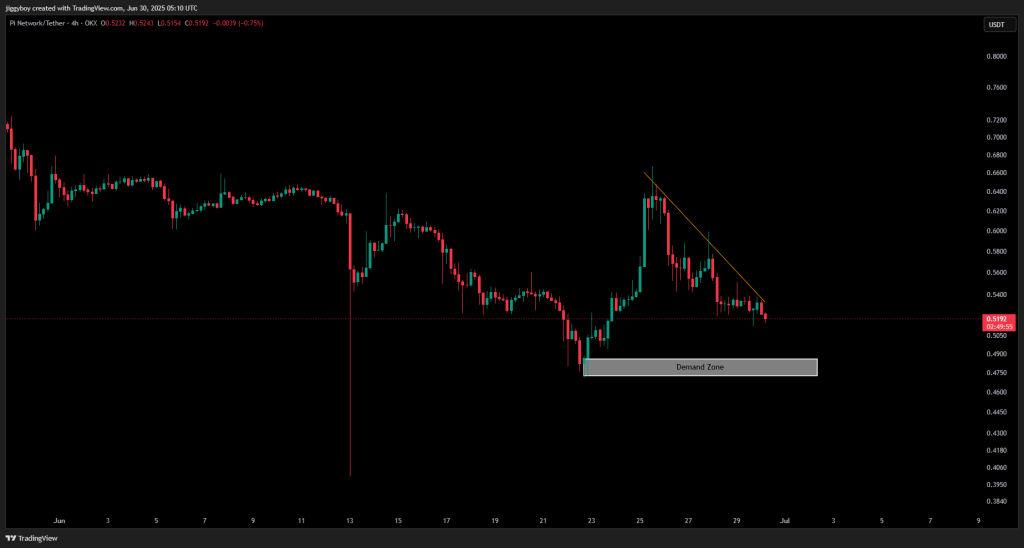
After failing to sustain gains above $0.64 on June 25, the token has retraced to the $0.51–$0.52 area, where it continues to consolidate just above the highlighted demand zone near $0.50.
Let’s take a closer look at today’s setup.
What you'll learn 👉
📅 What We Got Right Yesterday
In yesterday’s prediction, the risk of a breakdown below $0.52 was highlighted, with $0.47–$0.49 mentioned as the next support area if momentum weakened further.
The bearish scenario unfolded as Pi Coin price dropped below $0.52 and moved closer to the $0.50 level. Price is now hovering at $0.5185, with market activity thinning out and volume down more than 30%.
The neutral outlook also played out, with the token consolidating between $0.52 and $0.54 before the decline. No bullish catalysts emerged to push the price higher.
📊 Pi Coin Daily Overview (June 30)
- Current Price: $0.5185
- 24h Change: -2.3%
- Volume: Down over 30%
- Market Structure: Sideways with bearish bias
Pi Coin price action remains weak and stuck in a tight range. The $0.50–$0.54 zone has acted as a battleground for the past few sessions, but bears remain in control as momentum indicators flash red.
🔍 What the Pi Coin Chart Is Showing
The 4H chart reveals a sustained downtrend since mid-June, with a descending trendline from the $0.64 peak now serving as dynamic resistance. Pi Coin price has made several lower highs and continues to struggle to break above $0.54.
A demand zone between $0.48 and $0.50 remains the key support area to watch. Price bounced here on June 23, but momentum has not recovered since. If broken, it could trigger further losses toward $0.44.
Volume remains low, suggesting a lack of interest from buyers. Until the trendline breaks on volume, the setup favors bears.
📈 Technical Indicators (Hourly Timeframe)
| Indicator | Value | Interpretation |
| RSI (14) | 35.064 | Weak momentum, bearish setup |
| MACD (12,26) | -0.002 | Bearish crossover |
| CCI (14) | -170.19 | Deep in oversold territory |
| Ultimate Oscillator | 48.714 | Slight bearish tilt |
| ROC (Rate of Change) | -1.736 | Negative short-term pressure |
| Bull/Bear Power (13) | -0.0167 | Bears currently in control |
Summary: All indicators remain in sell territory. No reversal signals have appeared, and momentum continues to weaken as price approaches the demand zone.
🔮 Pi Coin Price Prediction Scenarios
Bullish Scenario:
A move above $0.54 and a clean breakout from the descending trendline could set up a test of $0.58–$0.60. This setup remains inactive.
Neutral Scenario:
If $0.50 holds, the Pi Coin price may trade sideways between $0.50 and $0.54 as volume fades and traders await direction.
Bearish Scenario:
A breakdown below $0.50 could accelerate the move to $0.47–$0.49. If this area fails, the next support lies near $0.44.
🧠 Wrapping Up
Pi Coin price remains stuck between falling resistance and short-term support, with market momentum and volume fading. Traders are closely watching the $0.50 level, which has become a line in the sand. Without a breakout above $0.54 or a breakdown below $0.50, the price may continue to trade sideways going into July.
Read Also: Here’s Why Pudgy Penguins (PENGU) Price Is Pumping
Subscribe to our YouTube channel for daily crypto updates, market insights, and expert analysis.