
Pi Coin remains under pressure after failing to hold recent gains. Despite a short-lived bounce earlier in the week, the token continues to trade below key resistance and it has been up 0.77% in the past day.
Price action remains weak, and momentum indicators suggest that sellers still have the upper hand heading into the weekend. After briefly breaking above its 9-day SMA, Pi Coin price peaked near $0.70 before pulling back.
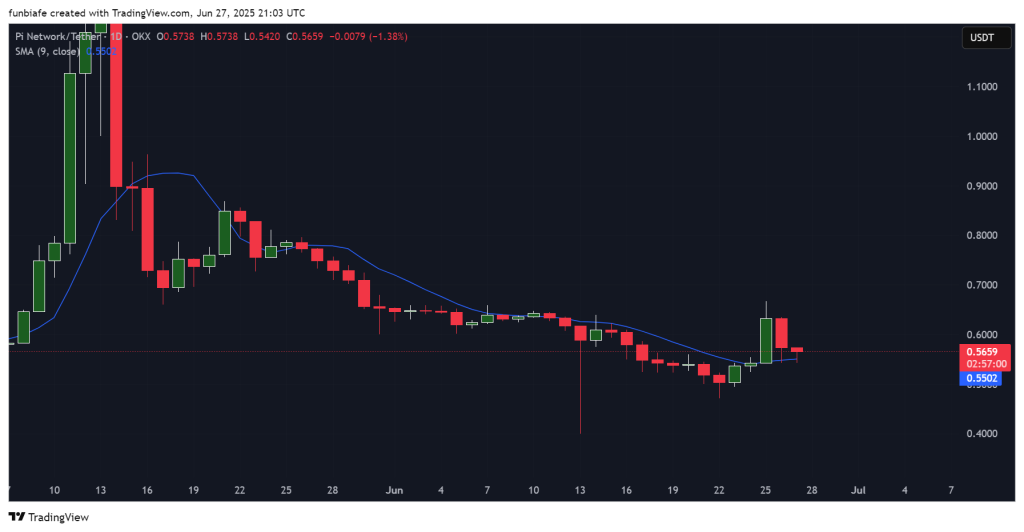
It is now trading around $0.5659, with buyers struggling to build on the initial rally. The setup points to a fragile market that has yet to find a clear direction.
Let’s break down the current structure.
What you'll learn 👉
📅 What We Got Right Yesterday
In yesterday’s prediction, we noted the importance of the $0.60–$0.67 range and noted that any failure to reclaim that zone could keep Pi Coin in a sideways pattern or send it lower.
That played out as expected. After testing the upper boundary early in the session, Pi Coin price reversed lower and closed below $0.57.
The bounce lost steam, and the red daily candle confirms hesitation. With no surge in volume or new catalysts, the token remains trapped below its short-term resistance band.
📊 Pi Coin Daily Overview (June 28)
- Current Price: $0.5659
- 24h Change: -1.38%
- 9-Day SMA: $0.5502
- Volume: Light and declining
Pi Coin price briefly reclaimed its 9-day SMA, but follow-through was weak. A large wick on the June 25 candle showed sellers entering above $0.65. Since then, the price has failed to push higher and is now hovering above key short-term support.
Read Also: Pi Coin Holders Celebrate: Was Avoiding Binance the Smartest Move Yet?
🔍 What the Pi Coin Chart Is Showing
The Pi Coin chart remains bearish, with lower highs stretching back to the May peak at $1.10. A weak bounce over the last few sessions suggests the market is stabilizing, but momentum is fading.
Immediate support lies around $0.54–$0.55. If that fails, $0.50 becomes the next area to watch. Resistance remains at $0.60, with a stronger ceiling at $0.70.
Volume has declined sharply, and candles show narrow bodies, a sign of indecision. Unless Pi Coin closes above $0.62 soon, the rally attempt could be short-lived.
📈 Technical Indicators (Daily Timeframe)
| Indicator | Value | Interpretation |
| RSI (14) | 52.79 | Neutral zone, momentum cooling |
| MACD (12,26) | -0.002 | Weak bearish momentum |
| CCI (14) | 76.74 | Mild bullish interest |
| Ultimate Oscillator | 42.48 | Bearish pressure continues |
| ROC | 3.374 | Slight upward movement |
| Bull/Bear Power (13) | 0.0056 | Bulls hold slight advantage |
Summary: The indicators remain mixed. Momentum is recovering but not strong. MACD and the Ultimate Oscillator suggest the trend is still fragile.
🔮 Pi Coin Price Prediction Scenarios
Bullish Scenario:
If Pi Coin can close above $0.67, it might make a run toward $0.70. But so far, that move hasn’t happened.
Neutral Scenario:
If Pi Coin price holds between $0.60 and $0.67, consolidation could continue into the weekend.
Bearish Scenario:
If Pi drops below $0.60, it could start heading back toward $0.52, with $0.50 likely being the next support level to watch.
🧠 Wrapping Up
Pi Coin is still stuck in a tight range, without any clear direction for now. Traders are keeping a close eye on the $0.60 level to see which way things might go next.
Unless Pi Coin price breaks above $0.67 or drops below $0.54, it’s probably going to keep moving sideways.
Right now, the setup leans more toward consolidation, and if volume keeps dropping, there’s a chance we could see more downside.
Subscribe to our YouTube channel for daily crypto updates, market insights, and expert analysis.