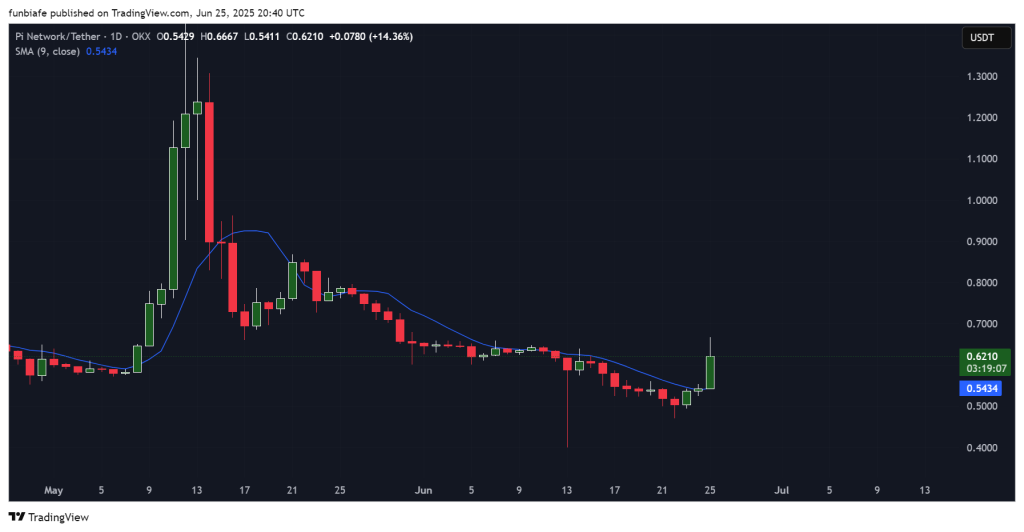
Pi Coin saw its strongest daily candle in weeks, as it broke above the short-term moving average and closed at $0.6210.
The move follows a period of sustained downtrend, where the token struggled to maintain support and stayed below key levels for most of June.
The price action signals a potential shift in momentum, though nearby resistance zones remain intact. Pi Coin price now sits in a new short-term range, with bulls and bears testing strength near $0.60–$0.67.
Let’s take a closer look at today’s setup.
What you'll learn 👉
📅 What We Got Right Yesterday
In yesterday’s prediction, we noted that a close above $0.57 with decent volume could trigger a move toward $0.62.
Pi Coin price followed that path exactly, breaking past the $0.57 level and tagging $0.6210 before sellers stepped in near resistance.
We also mentioned that $0.543, the 9-day SMA would act as a key support zone. Price not only reclaimed that level but closed well above it, and gave bulls short-term control. So far, the reaction has aligned with the bullish scenario we outlined.
📊 Pi Coin Daily Overview (June 26)
- Current Price: $0.6210
- 24h Change: +14.36%
- 9-Day SMA: $0.5434
- Daily Range: $0.5411 – $0.6667
Pi Coin posted a strong green candle and cleared the 9-day SMA for the first time since early June. However, the wick rejection near $0.6667 suggests that sellers are still active around resistance.
Pi Coin price is currently forming a short-term consolidation channel between $0.60 and $0.67. A breakout above that upper level could set up the next leg.
🔍 What the Pi Coin Chart Is Showing
The Pi Coin chart from mid-May to June was a clear downtrend, with lower highs and extended selling pressure. The breakout above the moving average introduces a possible trend shift, but one candle alone does not confirm reversal.
Support now lies near $0.60–$0.61. Resistance remains around $0.67–$0.70, where Pi Coin price was rejected during today’s session.
A move above $0.70 with volume would confirm short-term bullish continuation. If there’s no follow-through soon, this bounce might just fade out and turn into more sideways chop.
📈 Technical Indicators (Daily Timeframe)
| Indicator | Value | Signal / Interpretation |
| RSI (14) | 58.575 | Momentum building, bullish above 50 |
| MACD (12,26) | 0.02 | Bullish crossover, early trend shift |
| CCI (14) | -10.4842 | Neutral, stable market |
| Ultimate Oscillator | 54.864 | Mild bullish sentiment |
| ROC (Rate of Change) | 3.474 | Positive momentum |
| Bull/Bear Power (13) | 0.008 | Slight bull bias |
Summary: Most indicators now reflect a bullish bias, though the strength is still early and fragile. The CCI remains neutral, while ROC and MACD support rising momentum.
🔮 Pi Coin Price Prediction Scenarios
Bullish Scenario:
If Pi Coin manages to break above $0.67 with solid volume behind it, we could see it push up toward $0.70 or even a bit higher.
Neutral Scenario:
If Pi Coin price keeps trading between $0.60 and $0.67, it’ll likely stay in a sideways range for a while, at least until volume picks up.
Bearish Scenario:
If Pi Coin can’t stay above $0.60, it might slip back down to the $0.50–$0.52 zone, and if that breaks, things could get even rougher.
🧠 Wrapping Up
Pi Coin price posted a notable bounce, but long-term resistance remains overhead. Short-term indicators are starting to look bullish, and the price action hints that Pi Coin might be building a solid base here..
Still, we’ll need to see some follow-through to confirm the breakout. For now, the $0.60 to $0.67 range is setting the tone for where Pi Coin heads next.
Read Also: Pi Coin Price Surges Past Key Level: Is a Run to $1 Now in Sight?
Subscribe to our YouTube channel for daily crypto updates, market insights, and expert analysis.