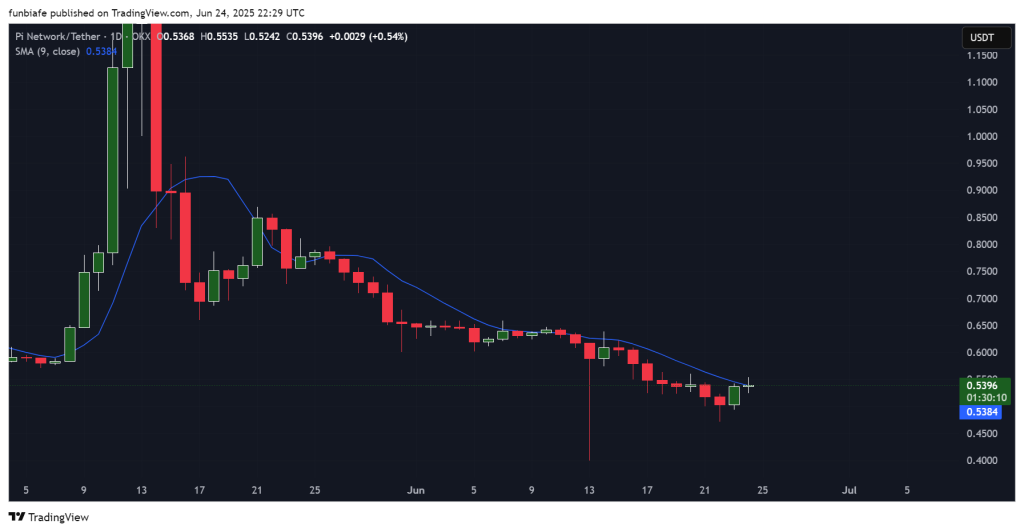
Pi Coin price just saw a small bounce after weeks of sliding down, and for the first time in a while, it managed to close just above its 9-day moving average, it is currently trading at $0.5422.
It’s a decent sign that things might be turning around, but most of the indicators are still pointing bearish for now.
Pi Coin is still trading below major resistance and hasn’t confirmed any clear breakout, it has been up 1.09% in the past day.
Let’s take a closer look at today’s setup.
What you'll learn 👉
📅 What We Got Right Yesterday
In yesterday’s prediction, we highlighted $0.57 as a key breakout level that could shift trend sentiment. That breakout has not occurred, and the price remains stuck below $0.55.
We also suggested that a neutral outcome would keep Pi Coin trading between $0.50 and $0.56. That range has held up, with the price now sitting at $0.5396, just above the 9-day SMA but without a confirmed trend reversal.
📊 Pi Coin Daily Overview (June 25)
- Current Price: $0.5396
- 24h Change: +0.54%
- 9-Day SMA: $0.5384
- Volume: Stable, but low
Pi Coin is attempting to stabilize after a prolonged slide. The $0.50–$0.47 zone has acted as a short-term floor. Pi Coin price has now closed just above the 9-day moving average, which has capped upside attempts since early June.
While this close is a positive sign, it needs follow-through. If the token can close above $0.55 with volume, it may aim for the $0.57–$0.60 resistance range next.
🔍 What the Pi Coin Chart Is Showing
The Pi Coin chart remains structurally bearish. Daily candles have been mostly red and small-bodied, showing weak momentum and seller dominance.
This is the first time in weeks that price has closed above the moving average. However, without volume and confirmation, this may not signal a true reversal.
The key level to watch on the downside is still $0.50, if that breaks, Pi Coin price could slip back down toward $0.47.
On the flip side, $0.55 is the next hurdle for the bulls, and if that gets cleared, the price might push toward $0.60 or even $0.62.
📈 Technical Indicators (Daily Timeframe)
| Indicator | Value | Signal / Interpretation |
| MACD (12,26) | -0.051 | Bearish crossover, downward trend in place |
| RSI (14) | 37.27 | Weak momentum, still under pressure |
| CCI (14) | -52.46 | Below average price, no bullish shift |
| Ultimate Oscillator | 57.30 | Mild buying strength emerging |
| ROC (Rate of Change) | -15.97 | Strong downside pressure remains |
| Bull/Bear Power (13) | -0.0356 | Bears still in control |
Summary: Most indicators are still leaning bearish, with only the Ultimate Oscillator showing some early signs that buyers might be stepping in. It’s a small spark, but not enough yet to support a full-on rally.
🔮 Pi Coin Price Prediction Scenarios
Bullish Scenario:
If Pi Coin can close above $0.57 with some decent volume behind it, that could shift short-term sentiment and set the stage for a move up to around $0.62.
Neutral Scenario:
If momentum starts to fade again, Pi Coin price might just keep chopping sideways between $0.50 and $0.56 for a while.
Bearish Scenario:
If Pi Coin drops below $0.50, it could head back down to test the $0.47–$0.48 zone again and maybe even fall lower if selling picks up.
Read Also: Is Pi Coin Stuck? 3 Big Reasons the Price Isn’t Moving
🧠 Wrapping Up
Pi Coin price is getting a little bounce right now, but the bigger trend is still pointing downward. One green candle above the 9-day SMA is a start, but not confirmation.
Traders are keeping an eye on the $0.55 to $0.57 zone to see if momentum really starts to shift. Until that happens, Pi Coin will probably keep moving sideways or maybe even dip again.
Subscribe to our YouTube channel for daily crypto updates, market insights, and expert analysis.