Pi Coin continues its slide as sellers maintain control over short-term momentum. Pi Coin has slipped out of its recent consolidation zone and is now trading at $0.5377, down 2.00% for the day.
There’s still no bullish catalyst in sight, and the technical indicators are all pointing to continued selling pressure. With Pi Coin price structure leaning lower and volume thinning, the trend remains downward unless a strong breakout occurs.
Let’s break down the latest price action and signals.
What you'll learn 👉
📊 Pi Coin Daily Overview (June 19)
- Current Price: $0.5377
- 24h Change: -2.00%
- RSI (14): 40.21
- Volume: Low and fading
Pi Coin price remains capped beneath a descending resistance line that has held firm since late May. Buyers attempted to break above this structure around June 13 but were rejected.
Since then, the price has resumed its downtrend, with limited bounce attempts. The $0.50–$0.52 area is still acting as a short-term buffer, but multiple retests suggest that support may be weakening.
🔍 What the Pi Coin Chart Is Showing
The Pi Coin chart is still following a classic downtrend, with lower highs and lower lows forming over time.
The descending trendline that’s been in place since May 24 is still holding strong, and price hasn’t tested it again since the last rejection.
Candles are increasingly narrow-bodied, and long upper wicks reflect aggressive selling during intraday recoveries. Unless bulls reclaim territory above $0.60 with conviction, the bearish structure is expected to persist.
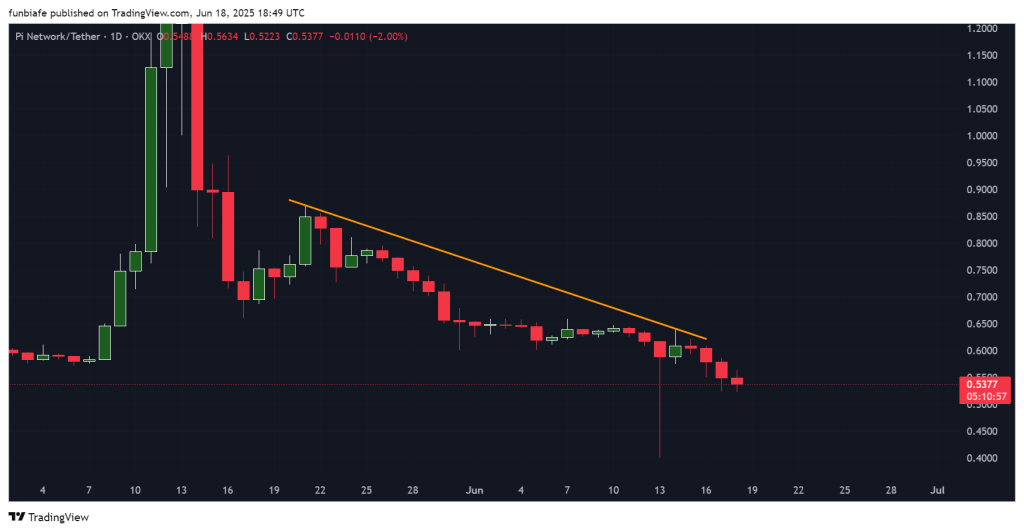
If $0.52 breaks down with volume, the next support area is located between $0.40 and $0.44, where buyers last showed interest in early May.
Read also: Here’s Why Pi Coin Price Will Never Hit $100
📈 Technical Indicators (Daily Timeframe)
| Indicator | Value | Signal/Interpretation |
| MACD (12,26) | -0.008 | Bearish crossover, negative momentum |
| ADX (14) | 35.783 | Strong trend strength, favors sellers |
| CCI (14) | -39.11 | Neutral zone, no strong momentum |
| RSI (14) | 40.216 | Bearish bias, momentum weakening |
| Ultimate Oscillator | 52.836 | Mild bullish divergence, limited short-term lift |
| ROC | -3.695 | Negative momentum, price under pressure |
| Bull/Bear Power (13) | -0.0029 | Bears slightly stronger |
Summary: Most indicators are still leaning bearish. MACD, ADX, and ROC all point to more downside ahead, while the Ultimate Oscillator shows a slight bullish divergence, but it hasn’t led to any real turnaround yet.
🔮 Pi Coin Price Prediction Scenarios
Bullish Scenario:
If Pi Coin can break above $0.60 with some solid volume behind it, we might see a quick move up toward $0.66. No signs of this setup have appeared yet.
Neutral Scenario:
If $0.52 holds up, Pi Coin price might just keep moving sideways between $0.52 and $0.60 while the market waits for something new to shake things up.
Bearish Scenario:
If Pi Coin drops clearly below $0.52, it could be headed toward the next support zone between $0.44 and $0.40, the same area it tested back in early May.
🧠 Wrapping Up
Pi Coin price remains under pressure, while it trades below a descending resistance line with no signs of strength from bulls. Sellers are still in control, and there hasn’t been enough volume to back up any of the recent bounce attempts.
Unless Pi Coin climbs back above $0.60 or something sparks a shift in sentiment, the trend is still leaning downward. Traders are keeping a close eye on the $0.52 support to see if it holds or breaks.
Subscribe to our YouTube channel for daily crypto updates, market insights, and expert analysis.