
Pi Coin remains in a tight consolidation range following weeks of declining momentum. With no major news or listings, the price action shows exhaustion, and technical indicators remain firmly in sell territory.
After failing to reclaim key resistance near $1.50 in May, the token has continued to trade sideways, now hovering just above $0.61.
Let’s take a closer look at today’s setup.
What you'll learn 👉
📅 What We Got Right Yesterday
In Yesterday’s prediction we pointed out the importance of the $0.636 level and suggested that if it failed, the price could slide toward $0.61 or lower.
That exact scenario unfolded, Pi coin price dropped below $0.636 and tested the $0.61 zone, where it continues to consolidate with weak momentum.
We also noted that unless a catalyst emerged, sideways movement between $0.636 and $0.66 was likely. The market followed this path, with no breakouts or bullish signs as of today’s open.
📊 Pi Coin Daily Overview (June 13)
- Current Price: $0.6140
- 24h Change: -3.05%
- 4H RSI (14): 39.34
- Volume: Low and declining
Pi Coin price has been trading in a narrow band for several days, with no clear trend reversal. Sellers continue to dominate, and the $0.60–$0.61 zone is acting as soft support. Price remains capped below the descending resistance line that has held since March.
🔍 What the Pi Coin Chart Is Showing
The daily chart still shows a prolonged downtrend, marked by lower highs and consistent rejection from a falling trendline.
After a failed breakout attempt in mid-May near $1.50, Pi coin price retraced sharply and has since stabilized in a weak consolidation range.
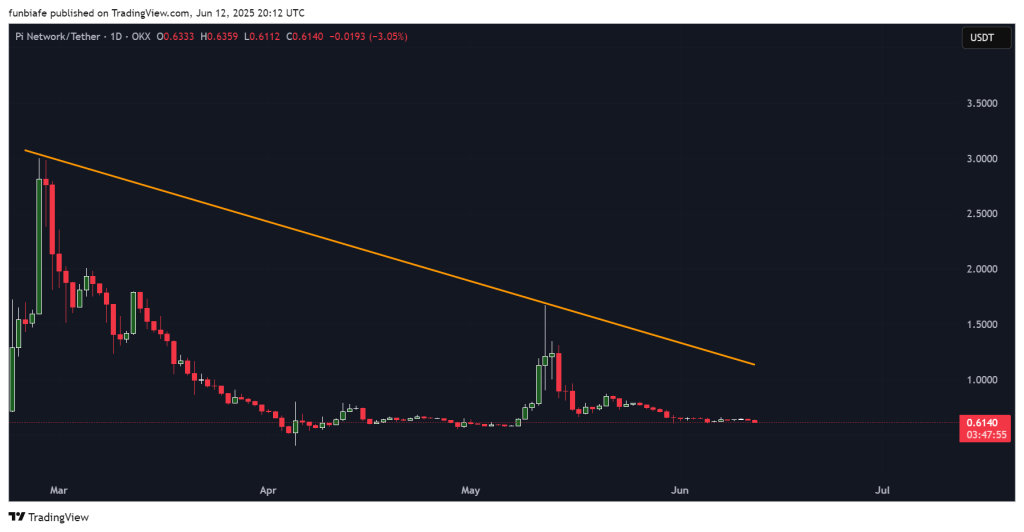
Volume is thin, and candles are small-bodied, a sign of indecision and fading interest. The chart structure remains bearish unless Pi reclaims $0.66 on volume.
While $0.60 is acting as a short-term floor, any breakdown below it could expose the token to deeper losses. The chart structure remains bearish unless Pi reclaims $0.66 on volume.
📈 Technical Indicators (Daily Timeframe)
| Indicator | Value | Signal / Interpretation |
| MACD (12,26) | -0.024 | Bearish crossover, weak momentum |
| ADX (14) | 41.532 | Strong trend strength, confirming downtrend |
| CCI (14) | -132.72 | Deep bearish pressure, nearing oversold |
| RSI (14) | 39.34 | Bearish momentum, not yet oversold |
| Ultimate Oscillator | 47.196 | Mild bearish sentiment |
| ROC (Rate of Change) | -12.891 | Strong negative momentum |
| Bull/Bear Power (13) | -0.053 | Bearish dominance remains |
Summary: All key indicators are aligned in a bearish direction. ADX confirms a strong trend, while MACD, ROC, and CCI show continued selling pressure. There are no bullish divergences or reversal signs on the daily timeframe.
🔮 Pi Coin Price Prediction Scenarios
Bullish Scenario:
A breakout above $0.66 with strong volume could lead to a short-term rally toward $0.70. No signs of this yet.
Neutral Scenario:
If $0.60 holds, Pi Coin may continue sideways between $0.60 and $0.66 until a catalyst appears.
Bearish Scenario:
A daily close below $0.60 could open the door for a drop to the $0.30 support zone tested in April.
🧠 Wrapping Up
Pi Coin price continues to struggle below long-term resistance, with no strong buying volume or news to spark upside momentum.
The current trend remains bearish, and traders are watching the $0.60 support for any signs of breakdown or bounce.
As of now, the most probable scenario for today is a continuation of the sideways chop between $0.60 and $0.66. A clear break on either side will likely set the tone for the next directional move.
Read Also: Why Pi Coin May Not Get Listed on Binance or Coinbase Anytime Soon
Subscribe to our YouTube channel for daily crypto updates, market insights, and expert analysis.

We recommend eToro
Wide range of assets: cryptocurrencies alongside other investment products such as stocks and ETFs.
Copy trading: allows users to copy the trades of leading traders, for free.
User-friendly: eToro’s web-based platform and mobile app are user-friendly and easy to navigate.