
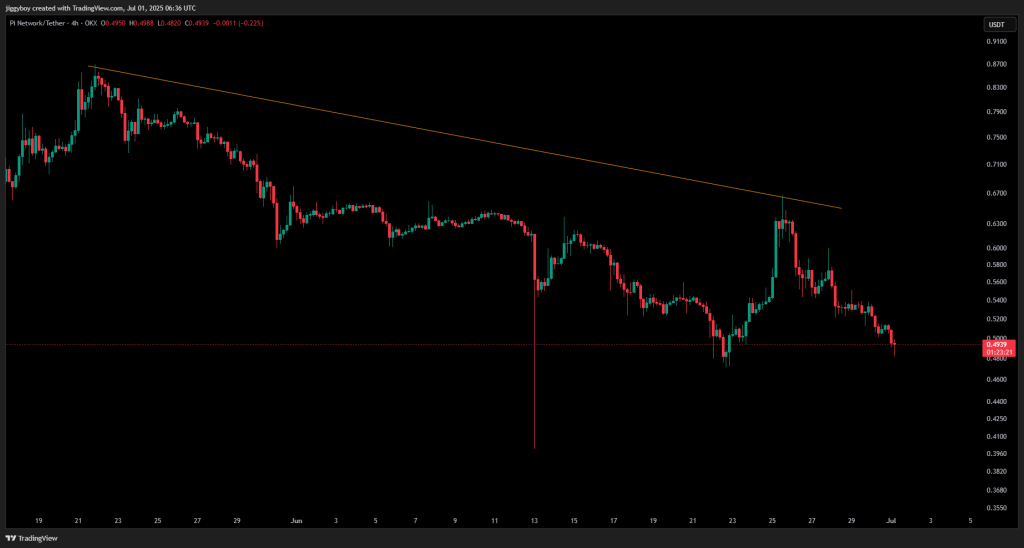
Pi Coin is still feeling the pressure after weeks of lower highs and repeated rejections from a strong descending trendline. At writing, Pi Coin price is sitting around $0.49, coming down sharply from its recent peak at $0.66.
Interestingly, trading volume is up by about 22%, which shows there’s still interest at these levels, but momentum indicators are still flashing red.
So far, the downtrend has stayed intact. Every bounce in June has been sold off quickly, and there hasn’t been a single breakout that held up. If buyers can’t push the price back above the $0.54 to $0.60 range soon, Pi Coin might keep heading lower.
Let’s take a closer look at today’s setup.
What you'll learn 👉
📅 What We Got Right Yesterday
In yesterday’s prediction, the bearish scenario outlined a possible breakdown below $0.50, with a target range of $0.47–$0.49. That scenario played out precisely. The price broke below $0.50 and is now testing the $0.49 level, validating the previous analysis.
The neutral scenario anticipated consolidation between $0.50 and $0.54 if $0.50 held, but selling pressure overpowered support. The bullish path required a clean break above $0.54 and the descending trendline, a move that remains inactive.
📊 Pi Coin Daily Overview (July 1st)
- Current Price: $0.4940
- 24h Change: -3.02%
- 4H RSI (14): 35.32
- Volume: Rising sharply (↑22%)
Pi Coin price is sitting just above the immediate support near $0.48. The price structure is still bearish, with lower highs at $0.91, $0.83, $0.71, and $0.66. The descending trendline has rejected each attempt at recovery. Unless the price breaks above this resistance with conviction, downside targets may stay in focus.
🔍 What the Pi Coin Price Chart Is Showing
The 4H chart displays a well-formed bearish trend. The price has consistently made lower highs, while each bounce has triggered sell-offs at resistance. The recent rejection at $0.66 followed a pattern similar to previous failed rallies.
Candle formations remain bearish, with minimal bullish reaction at current support. While $0.48 is holding for now, a break below this level may expose the token to further declines toward $0.43 or even $0.355 in extended bearish scenarios.
Read Also: SUI Price to $5? Van de Poppe Sees Uptrend Starting Soon
📈 Technical Indicators (Hourly Timeframe)
| Indicator | Value | Signal / Interpretation |
| RSI (14) | 35.325 | Near oversold, weak buying pressure |
| MACD (12,26) | -0.007 | Bearish crossover, no reversal signals |
| CCI (14) | -96.0482 | Strong downside pressure, close to oversold |
| Ultimate Oscillator | 38.708 | Bearish momentum, no strength in buying |
| ROC (Rate of Change) | -3.673 | Sharp downward movement |
| Bull/Bear Power (13) | -0.0104 | Bears remain in control |
Summary: Indicators show strong bearish momentum across all metrics. RSI and CCI are approaching oversold territory, but there are no signs of reversal. MACD and ROC confirm the downtrend.
🔮 Pi Coin Price Prediction Scenarios
Bullish Scenario:
A recovery above $0.54, followed by a breakout over the descending trendline, could trigger a rally to $0.60. There is no confirmation of this setup.
Neutral Scenario:
Sideways trading may resume between $0.48 and $0.52 for Pi Coin price if the current support holds and selling volume decreases.
Bearish Scenario:
A sustained move below $0.48 could accelerate losses toward $0.43. If that fails, $0.355 may act as the next major support zone.
🧠 Wrapping Up
Pi Coin price remains under clear bearish pressure. Resistance zones continue to cap every rally attempt, and short-term technical indicators align in a downward direction. While the price is holding just above a key support, no reversal signs have formed. Traders are watching closely to see if $0.48 can hold or if a deeper retracement is next.
Subscribe to our YouTube channel for daily crypto updates, market insights, and expert analysis.