Pi Coin closed lower yesterday, ending the day at $0.6508 after failing to break through the $0.66 resistance level. In our previous article, we noted that holding above $0.64 and clearing the $0.66–$0.68 zone could open a path to $0.70 or even $0.75. That breakout has not happened, and the price remains stuck in a narrow range.
Let’s take a look at where Pi Network might be headed today.
What you'll learn 👉
Pi Coin Chart Analysis
On the daily chart, Pi Coin price is consolidating within a descending triangle pattern that has been forming since early March. After a strong rally to over $3.00, the price gradually declined, forming a series of lower highs. The price has now compressed between a descending resistance trendline and a horizontal support zone between $0.62 and $0.64.
Read Also: Why Is FET Price Up? On-Chain Metrics Behind Fetch.ai’s Rally
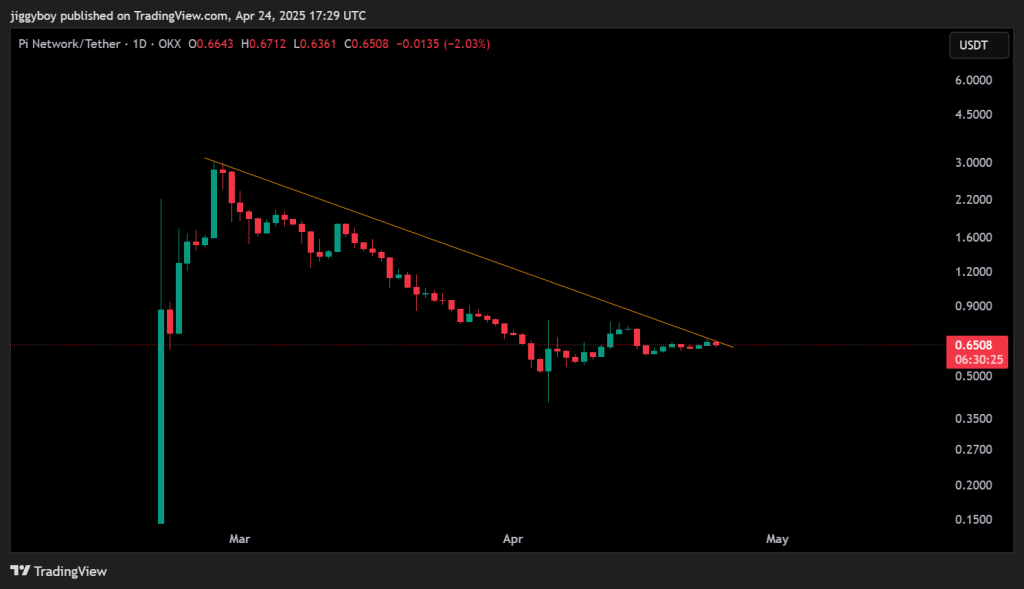
The current price sits at $0.6508, just below the trendline, suggesting that a breakout or breakdown is near. The support at $0.62 has held so far, but falling below it could see a retest of the $0.50 level, last seen during a sudden sell-off earlier this month. On the flip side, breaking above $0.68 could see a short-term rally to $0.75–$0.80.
For the meantime, Pi Coin price is in a consolidation and the next direction will most likely be based on volume and overall direction of the crypto market.
Daily Technical Indicators
Pi Coin’s technical indicators are showing mixed signals. The MACD is still negative, which points to lingering bearish momentum. At the same time, several momentum indicators are tilting bullish.
| Indicator | Value | Interpretation |
| MACD (12,26) | -0.091 | Bearish, downward momentum persists |
| CCI (14) | -5.0977 | Neutral, price trading near average |
| Ultimate Oscillator | 53.78 | Mild bullish pressure is building |
| ROC (Rate of Change) | 10.029 | ✅ Strong upward momentum developing |
| Bull/Bear Power (13) | 0.0157 | Buyers slightly in control |
The Rate of Change and Ultimate Oscillator both suggest that bullish momentum could be forming, but it’s not strong enough yet to overcome resistance without increased trading volume.
Pi Coin Price Predictions for April 25
If Pi Coin holds above $0.64 and breaks past $0.66–$0.68, a move toward $0.70 or even $0.75 could happen in the short term. The ROC and Ultimate Oscillator point to improving sentiment, but it’s too early to expect a breakout without confirmation.
On the flip side, if Pi Coin price dips below $0.64 again, it could slide toward the $0.60–$0.58 support zone. A breakdown there may expose the $0.53–$0.55 region. With the MACD still bearish and the CCI flat, traders should be cautious.
Today’s trend remains neutral to slightly bullish. Watch the $0.68 resistance and $0.64 support, whichever breaks first will likely decide Pi Coin’s next move. Bitcoin’s price direction will also play a major role in shaping short-term momentum.
Subscribe to our YouTube channel for daily crypto updates, market insights, and expert analysis.

We recommend eToro
Wide range of assets: cryptocurrencies alongside other investment products such as stocks and ETFs.
Copy trading: allows users to copy the trades of leading traders, for free.
User-friendly: eToro’s web-based platform and mobile app are user-friendly and easy to navigate.