The Pi Coin price had one of the better weeks since late February as the price bounced off local lows around 20% and is now trading around $0.73.
In our yesterday’s Pi Coin price prediction piece, we correctly predicted that a failure to break above $0.78 resistance may lead to a pullback toward the $0.72–$0.73 support range and this is exactly what happened.
So, where is the Pi Network’s token headed today? Let’s have a look.
What you'll learn 👉
Pi Coin Chart: Technical Analysis
Pi Coin recently broke out of a descending channel that had contained price action from March through early April. This breakout occurred on April 5th with a strong bullish move and this could be a shift in the token’s trajectory.
Since then, the Pi Coin price has found stability above the previous resistance level and is now moving sideways between $0.70 and $0.75.
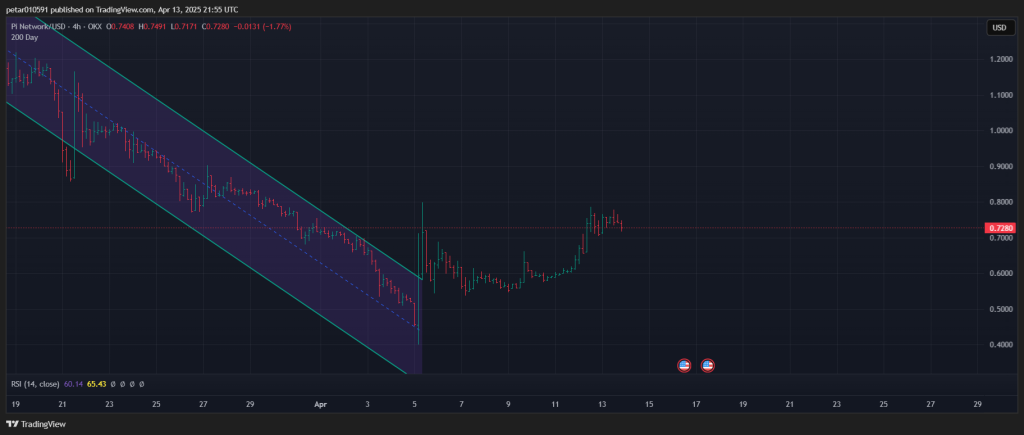
Currently trading at around $0.728, Pi Coin sits slightly below recent local highs but remains above the crucial $0.70 support level on the daily chart, which signals a generally bullish medium-term outlook.
| Indicator | Value | Interpretation |
|---|---|---|
| RSI (14) | 65.43 | Near overbought (70), but still in bullish territory. Some room to go higher. |
| MACD (12,26) | -0.079 | Still negative but close to crossing over. A bullish crossover could happen soon. |
| Ultimate Oscillator | 47.557 | Neutral; neither oversold nor overbought. Slight bearish bias. |
| ROC (Rate of Change) | -6.013 | Negative ROC signals weakening momentum or possible retracement. |
| Bull/Bear Power | 0.1434 | Slightly positive; indicates bulls have a slight upper hand in the current range. |
The technical indicators show mixed signals. The MACD remains in negative territory which means the bearish momentum hasn’t completely disappeared. This is further confirmed by the Rate of Change (ROC) at -6.013, indicating a slowdown in momentum following the recent rally. The Ultimate Oscillator reading below 50 hints that buying strength may be diminishing.
Despite these cautionary signals, several bullish factors remain in play. The breakout from the descending channel represents a major structural shift that remains valid. Price is holding firmly above the $0.70 support, and the RSI stands strong at 65, not yet reaching overbought territory.
The current consolidation phase following the breakout could actually be bullish if accompanied by sufficient volume for the next upward movement.
Pi Coin Price Forecast for Today
If Pi Coin manages to break and close above the $0.75 resistance with strong RSI and a positive shift in the MACD, we could see a move toward the $0.80-$0.84 range. This target is based on projections from the recent impulsive leg up. Traders should look for strong volume and a breakout of $0.75 range as confirmation.
Alternatively, if Pi fails to overcome the $0.75 resistance level and the RSI begins to decline, we could see a retest of support zones at $0.695, possibly extending down to $0.67. This bearish scenario would likely be triggered if the MACD remains negative, trading volume decreases, and the ROC stays below zero.
The consolidation just under the resistance zone between $0.74 and $0.75 indicates possible exhaustion from recent buying pressure, making the next few hours crucial for determining the short-term direction.
Subscribe to our YouTube channel for daily crypto updates, market insights, and expert analysis.

We recommend eToro
Wide range of assets: cryptocurrencies alongside other investment products such as stocks and ETFs.
Copy trading: allows users to copy the trades of leading traders, for free.
User-friendly: eToro’s web-based platform and mobile app are user-friendly and easy to navigate.