After pumping 15% today, the Pi Coin price broke past $0.65 resistance and is now trading around $0.68. We want to be fair and say that we didn’t anticipate this in our yesterday’s Pi Coin price prediction piece where our maximum daily price was $0.61.
So, where is the Pi Coin price headed today? Let’s have a look.
What you'll learn 👉
Recent Pi Coin Chart Structure Analysis
For a few weeks, Pi was trapped in a clearly defined downward channel. This pattern finally broke on April 5, with a signal that the end of the sustained bearish momentum we’ve been seeing. After this breakout, Pi entered a sideways consolidation phase, creating a stable base near the $0.60 mark.
The last 48 hours have shown strong bullish intent, with Pi climbing to $0.6854. We’re seeing a clear breakout from the consolidation range, forming what appears to be a short-term bullish continuation pattern. The next visible resistance level sits around $0.75-$0.78, where Pi previously found support before experiencing a significant drop. Immediate support levels are now at $0.62-$0.64, right at the previous consolidation range.
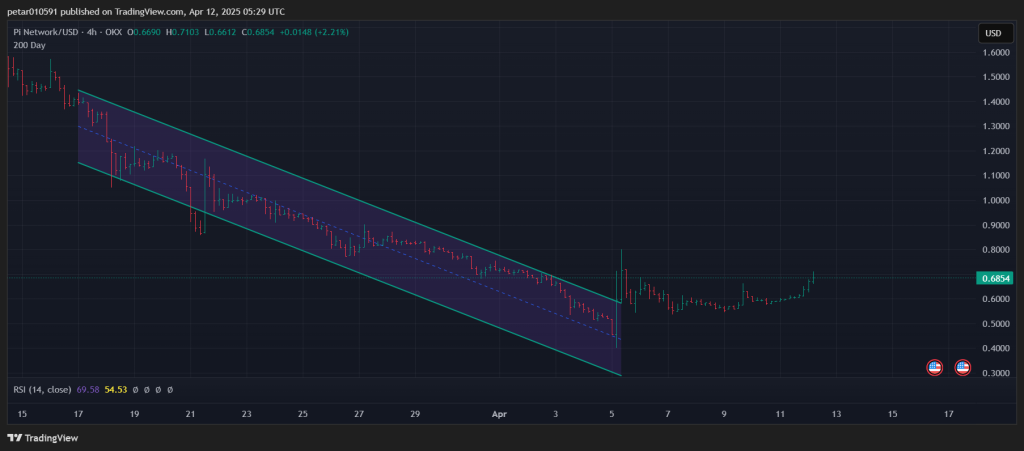
Looking at the RSI on the 4-hour timeframe, it’s currently at 69.58, just on the edge of entering overbought territory (above 70). This suggests strong bullish momentum but also hints that we might see a short-term cooldown or sideways movement soon.
Technical Indicator Analysis
The broader technical indicators offer a mixed picture. The Ultimate Oscillator reads at 49.252, which is essentially neutral – neither overbought nor oversold. This suggests a balanced but slightly improving momentum that could move in either direction based on the next few candles.
The Rate of Change (ROC) sits at -14.711 and indicates bearish momentum still lingers on a longer timeframe. This negative reading shows that the price remains lower compared to its period average. However, the short-term chart action is beginning to show signs of recovery.
MACD (12,26) is currently at -0.088, still below the signal line and in negative territory. This means the momentum hasn’t officially flipped bullish on the daily timeframe yet, though it’s approaching a crossover which could signal a change in trend.
The Highs/Lows (14) indicator is essentially flat at 0.0004, suggesting no clear trend dominance on the daily level – it’s neutral to slightly bullish at best.
Read also: Pi Network Faces Mounting Challenges as Mass Token Unlock Sparks Community Backlash
Pi Coin Price Outlook for April 12
If the bullish momentum holds and the RSI doesn’t overheat too quickly, Pi could target the $0.74-$0.78 range, which represents the next resistance zone from late March. A break above $0.78 might open the path to test the psychological $0.85 level.
On the flip side, if the nearly overbought RSI triggers a rejection and the price dips below $0.64, we could see a pullback to the $0.60-$0.58 range, which served as the recent consolidation base. Should the price break below $0.58, it would invalidate the current short-term bullish setup and potentially revisit the $0.52 level.
Subscribe to our YouTube channel for daily crypto updates, market insights, and expert analysis.

We recommend eToro
Wide range of assets: cryptocurrencies alongside other investment products such as stocks and ETFs.
Copy trading: allows users to copy the trades of leading traders, for free.
User-friendly: eToro’s web-based platform and mobile app are user-friendly and easy to navigate.