Gold just closed its worst month since 2008. In march, we saw gold had heavy dips, with prices falling into the low $4,000s before a dramatic reversal. But in the last week of the month, gold caught fire, rallying nearly 15 percent from the March 23 bottom. Now, the gold price is around $4,700 per ounce.
Peter Schiff, the long-time gold bull and Bitcoin critic, took some time to tweet about gold. He pointed out the unusual setup: March was gold’s worst monthly performance in 17 years, yet the final days of the month produced a furious rally that carried into April. Schiff suggested that April could become gold’s best month since 1980. That would be a historic turnaround.
His logic is simple. The big selloff in March flushed out weak hands and reset sentiment. The subsequent rally, driven by physical demand and a weakening dollar narrative, has momentum behind it. With the Federal Reserve done raising rates and geopolitical tensions still simmering, Schiff sees gold entering a new leg higher.
Gold is above $4,700. Since bottoming on March 23rd (my birthday), gold has rallied close to 15% in just over one week, finishing the quarter up about 7%. Despite today's rise, March was the worst month for gold since 2008. As a result, April may be gold's best month since 1980.
— Peter Schiff (@PeterSchiff) April 1, 2026
Gold Price Chart Analysis
The 2‑hour PAX Gold chart from TradingView shows the strength of the recent move. PAXG trades at $4,687, well above the 200‑day moving average sitting at $4,450. Price cleared that level with conviction last week and has held above it ever since.
The rally from the March 23 low near $4,080 to the current level represents a clean breakout. The 200‑day MA now acts as the first major support zone. Below that, $4,500 is a psychological level that held during the initial push higher.
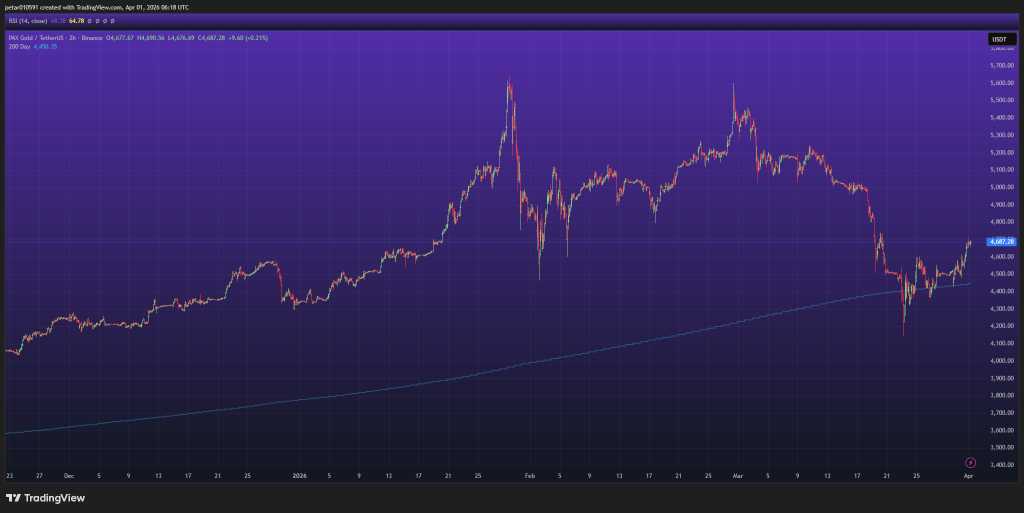
On the upside, resistance appears at $4,700. PAXG briefly touched $4,690 in the latest candle, showing buyers are testing that level. A clean break above $4,700 opens the door to $4,800, then $4,900. The next significant resistance beyond that sits at $5,000, a major round number that could act as a magnet for momentum traders.
RSI on the 2‑hour chart reads 68.38, approaching overbought territory but not yet at extreme levels. In strong trends, RSI can remain elevated for extended periods. A pullback to cool off the indicator would likely find support near the 200‑day MA.
Gold Price Prediction for April
If Schiff is right and April mirrors 1980, gold could see explosive upside. That year, gold rallied from roughly $500 to over $800 in a matter of weeks, a 60 percent move. A similar percentage move from current levels would push gold toward $7,500. That sounds extreme, but the setup (worst month in years followed by a sharp reversal) has precedents.
A more conservative (and to be fair more realistic) target would be $5,200 by the end of April. That would represent a 10‑12 percent gain from current levels, in line with the momentum already established. The key levels to watch are $4,700 as immediate resistance and $4,500 as the line in the sand for bulls. As long as price stays above the 200‑day MA, the trend remains bullish.
The wildcard remains the dollar. If the dollar continues its slide, gold gets an extra tailwind. Central bank buying and physical inventory drawdowns in London and Shanghai add fundamental fuel. April could indeed be a memorable month for gold.
Subscribe to our YouTube channel for daily crypto updates, market insights, and expert analysis.