
Optimism price is closing out the month on a strong note, jumping over 14% in just one day. That surge put it among the top 3 gainers across the market, with trading volume spiking more than 640%.
The main driver behind OP’s rally is its listing on Upbit, South Korea’s largest exchange. Upbit introduced trading pairs for OP/KRW, OP/BTC, and OP/USDT, triggering a wave of fresh volume and interest.
Upbit now accounts for nearly 30% of OP’s total 24-hour volume, with the token’s trading activity jumping to over $940 million. That kind of exposure, especially with low KRW fees, can bring in both retail and institutional buyers.
At the same time, nearly 31.34 million OP tokens (worth ~$22.9M) are set to unlock. Usually, unlocks of this size (1.93% of supply) trigger short-term dips. But so far, the demand from Upbit appears to be absorbing it.
But with only a few days left in July, the big question is, can this late momentum carry into August, or will it face resistance soon?
What you'll learn 👉
How Did Optimism (OP) Perform in July?
Optimism price started July trading around $0.64 and stayed fairly quiet for most of the month. The price hovered between $0.62 and $0.71, showing little momentum until the final week.
Things changed quickly after news of a major listing on Upbit. That catalyst sparked a strong move, sending OP above $0.82 within hours.
The surge made OP one of the biggest gainers of the week, and trading volume exploded past $940 million, with nearly a third coming from Korean markets.
This late breakout gave OP price some much-needed bullish momentum after weeks of sideways movement, shifting short-term sentiment to the upside.
OP Chart Analysis
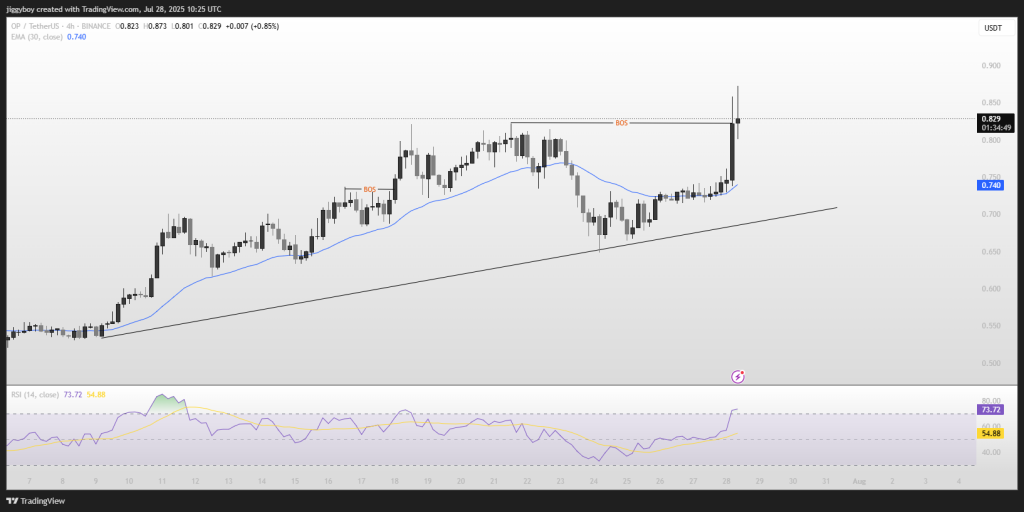
Looking at the Optimism 4H chart, the structure remains firmly bullish. The price has been climbing steadily since early July, forming consistent higher lows and higher highs.
Most recently, OP price broke out of a local range and pushed to $0.873. It’s now consolidating around $0.829, just under that level. This is a textbook bullish breakout and retest setup.
Support lies at the 30 EMA ($0.740) and an ascending trendline intersecting around $0.72–$0.74. A breakdown below that could send OP back toward $0.68–$0.70, but for now, the trend remains intact.
Read Also: Why Is PancakeSwap (CAKE) Price Pumping Today?
Technical Indicators (Monthly Timeframe)
| Indicator | Value | Signal / Interpretation |
| ADX(14) | 38.70 | Strong trend, bearish direction |
| CCI(14) | -105.03 | Oversold, bearish momentum |
| Ultimate Oscillator | 36.85 | Weak buying pressure |
| ROC | -66.39 | Strong downward momentum |
| Bull/Bear Power(13) | -1.063 | Bears in control |
Despite the recent 4H rally, the monthly indicators tell a different story. All signals lean bearish, pointing to sustained sell pressure on the higher timeframe. This could limit upside potential unless momentum shifts more broadly.
Optimism Price Forecast for August
Let’s break it down into two scenarios.
Bullish Scenario:
If OP continues to hold above $0.80 and breaches $0.873 again, we could potentially test $0.90–$0.95. A close above $0.95 would have $1.00 in its sights; however, that would have to be achieved with strong follow-through volume and general market strength.
Bearish Scenario:
If OP price stays above $0.80 and breaks $0.873 again, then we can see a rally to $0.90–$0.95. Above $0.95 close would make $1.00, but it would need strong volume follow-through and general market strength.
Wrapping Up
Optimism price has the short-term momentum, but the monthly picture still shows caution. If you’re already in a position, it might be wise to trail stops and see how the price behaves around $0.87. For new entries, waiting for confirmation above $0.90 or a retest around $0.72 might be the smarter move.
Are you trading OP this month, or watching from the sidelines? Let me know below.
Subscribe to our YouTube channel for daily crypto updates, market insights, and expert analysis.