
Have you noticed how Ondo has been trading sideways lately? ONDO token seems to be quietly consolidating, waiting for the right moment.
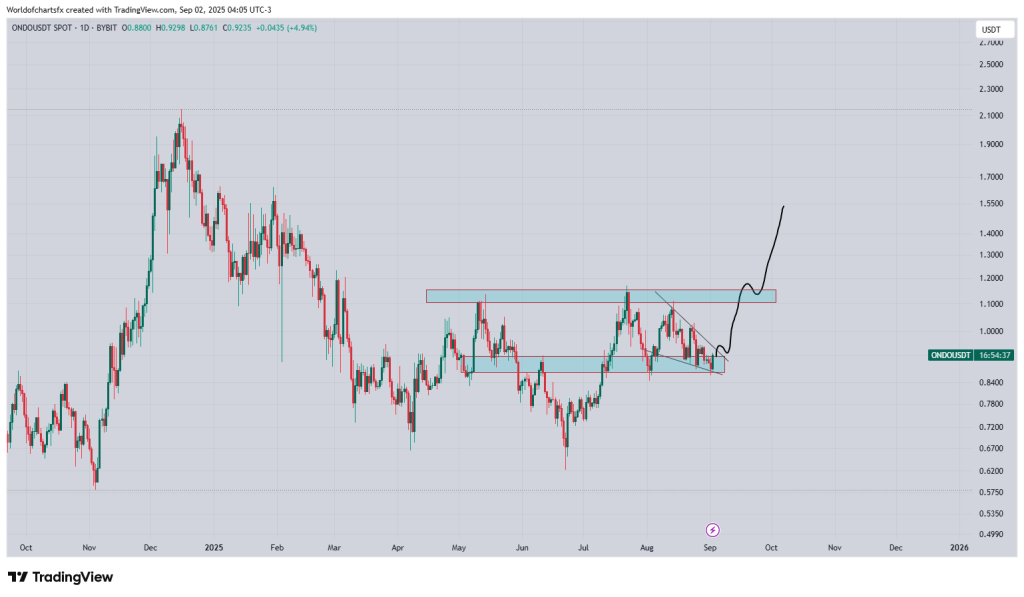
According to World Of Charts on X, a successful breakout could spark a strong bullish wave. Looking at the Ondo price chart, it’s clear that the market has been testing resistance and support levels for weeks.
A retest seems necessary before it can finally push higher. This reminds some people of Solana in its early days, slowly building momentum before a big move.
The chart shows that Ondo price has been bouncing between $0.61 and $1.17 for the past 6 months . This sideways movement forms a consolidation zone. Consolidation periods often act like a spring. The longer the spring is compressed, the stronger the potential push once it releases. World of Charts noted that for Ondo’s price, breaking above the $1.17 level could trigger a bullish wave.
What ONDO Technical Indicators Suggest
Technical indicators from investing .com provide more insight into where the Ondo token might go next. The table below shows key indicators along with a descriptive explanation of their current values and suggested actions:
| Name | Value | Action |
| RSI (14) | 44.813 | Below 50 → slight selling pressure, not extreme. |
| STOCH (9,6) | 28.92 | Near oversold → price may rise if momentum improves. |
| MACD (12,26) | -0.023 | Slightly negative → weak bearish momentum. |
| ADX (14) | 41.036 | Strong trend → market could make a big move. |
| CCI (14) | -85.2992 | Low value → asset may be undervalued short-term. |
| Ultimate Oscillator | 41.543 | Weak buying pressure → needs more momentum for breakout. |
| Bull/Bear Power (13) | -0.0502 | Slight bearish pressure → bulls may step in at support. |
Analyzing these indicators together, most suggest a market in temporary weakness but ready for a potential bullish shift. Consolidation combined with low stochastic levels often precedes a breakout. A retest at support could act as the final setup before Ondo price climbs higher.
Could Ondo Token Be Ready for a Bullish Wave?
The combination of chart patterns, consolidation behavior, and technical indicators points to a likely scenario: ONDO token may retest support around $0.87 and then attempt a breakout above $1.12. A successful push past this resistance could trigger a strong bullish wave.
World Of Charts noted this potential scenario, suggesting that traders watching Ondo closely should pay attention to how price behaves near these critical levels.
Read Also: Here’s When Shiba Inu (SHIB) Price Could Rally Back Toward Its All-Time High
Ondo price could see upward momentum similar to coins that build slowly before big moves. Watching for retests and momentum shifts is key to understanding if the bullish wave is real or just a temporary spike.
Subscribe to our YouTube channel for daily crypto updates, market insights, and expert analysis.


![Best Online Crypto Casino 2026: Spartans, Betpanda, Bitz & Cloudbet [Expert Review]](https://captainaltcoin.com/wp-content/uploads/2026/04/image-283-336x220.jpeg)

