
Despite the recent bullish trends in the cryptocurrency market, Ethereum (ETH) seems to be lagging behind its peers.
While Bitcoin (BTC), Chainlink (LINK), Bitcoin Cash (BCH), and Ripple (XRP) have all posted nice gains, Ethereum’s performance has been relatively subdued. Last week, the coin saw a modest 1.8% increase, leaving it trading around the $1,650 mark.
What you'll learn 👉
Technical Analysis: A Roller Coaster of Emotions
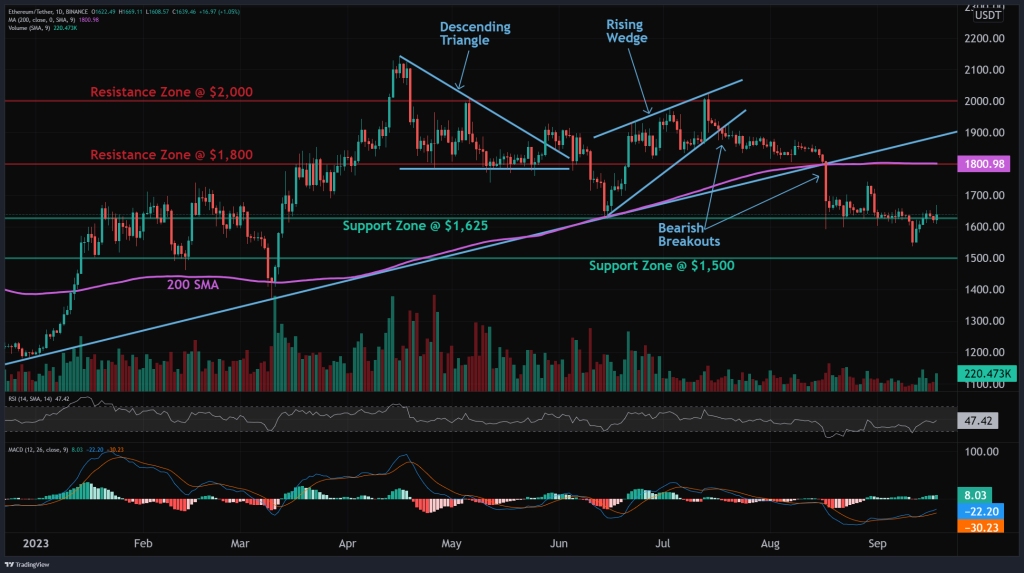
Ethereum recently suffered a bearish breakout from a Rising Wedge pattern, plunging below the critical $1,800 level and its 200-day Moving Average. However, as it neared the $1,500 support zone, the Relative Strength Index (RSI) dipped below 30, signaling an oversold condition. This led to a rebound, pushing the price back above the $1,600 key level.
Source: altFINS – Start using it today
The Moving Average Convergence Divergence (MACD) indicates a bullish crossover, suggesting that near-term momentum is on the upside. However, the RSI hovers around the 50 mark, indicating a neutral sentiment. Overall, Ethereum is in a downtrend across all time horizons—short, medium, and long-term.
The immediate support zones for Ethereum are at $1,625 and $1,500. On the flip side, resistance levels are pegged at $1,800, followed by $2,000 and $2,140.
On-Chain Metrics: The Profit-to-Loss Ratio
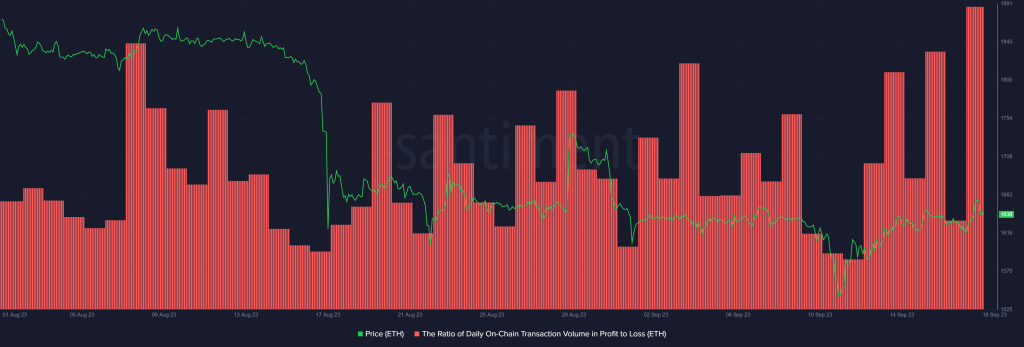
One intriguing metric is the daily on-chain transaction volume ratio of profit to loss for Ethereum. This ratio aims to gauge the overall sentiment and profitability of transactions on the Ethereum blockchain for a given day.
Interpreting the Ratio
- Ratio > 1: Indicates a bullish sentiment, as more transactions are profitable than those at a loss.
- Ratio < 1: Signifies a bearish sentiment, as more transactions are at a loss compared to those in profit.
- Ratio = 1: Represents a neutral market sentiment, where the volume of profitable transactions equals those at a loss.
Current Scenario: Highest Ratio in Two Months (1.9)
Source: Santiment – Start using it today
Yesterday’s ratio of 1.9 is the highest in the last two months, suggesting:
- Strong Bullish Sentiment: A significantly larger volume of transactions is profitable, indicating strong bullish sentiment among Ethereum users.
- Potential Overheating: While a high ratio is generally positive, extreme levels could signal that the market is due for a correction.
- Increased Activity: The high ratio may also indicate increased trading or transaction activity, as more participants are likely moving their ETH to capitalize on favorable market conditions.
- Investor Confidence: This could be a sign of robust investor confidence, possibly fueled by technological upgrades or positive market conditions.
Conclusion
While Ethereum may be underperforming in comparison to other cryptocurrencies, its on-chain metrics tell a more nuanced story. Investors and traders should keep an eye on both technical indicators and on-chain metrics to make informed decisions.
We recommend eToro
Wide range of assets: cryptocurrencies alongside other investment products such as stocks and ETFs.
Copy trading: allows users to copy the trades of leading traders, for free.
User-friendly: eToro’s web-based platform and mobile app are user-friendly and easy to navigate.


