SEI could be gearing up for a big move soon. Two well-known analysts, Ali Martinez and Alpha Crypto Signal, are both spotting the same pattern, a falling wedge that usually signals the end of a downtrend and the start of a reversal. After weeks of lower highs and steady support, SEI might finally be ready to break free.
What you'll learn 👉
The SEI Falling Wedge Is Tightening
Ali pointed out on X that the SEI hourly chart clearly shows a falling wedge pattern, one of the most reliable bullish reversal setups in technical analysis. The structure indicates price compression, with sellers running out of momentum while buyers slowly step in.
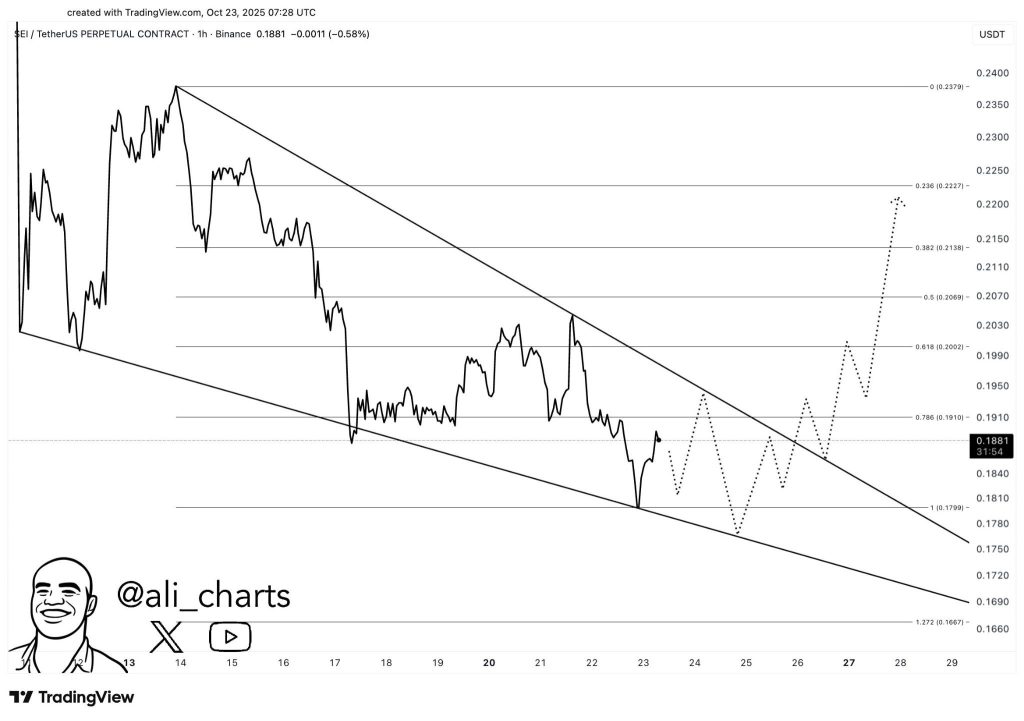
If the SEI price manages to break above the wedge, Ali sees a potential rally straight toward $0.22, and possibly even higher if momentum picks up quickly.
The pattern is clear, volume is starting to increase, and the price action is hinting at accumulation, all signs that the breakout could be closer than it seems.
Key Levels That Could Define the SEI Move
Alpha Crypto Signal’s 4-hour chart backs up this outlook. The SEI price has been bouncing between $0.185 and $0.192, forming a strong base of support that keeps attracting buyers. As long as the price holds above that range, the structure remains bullish.
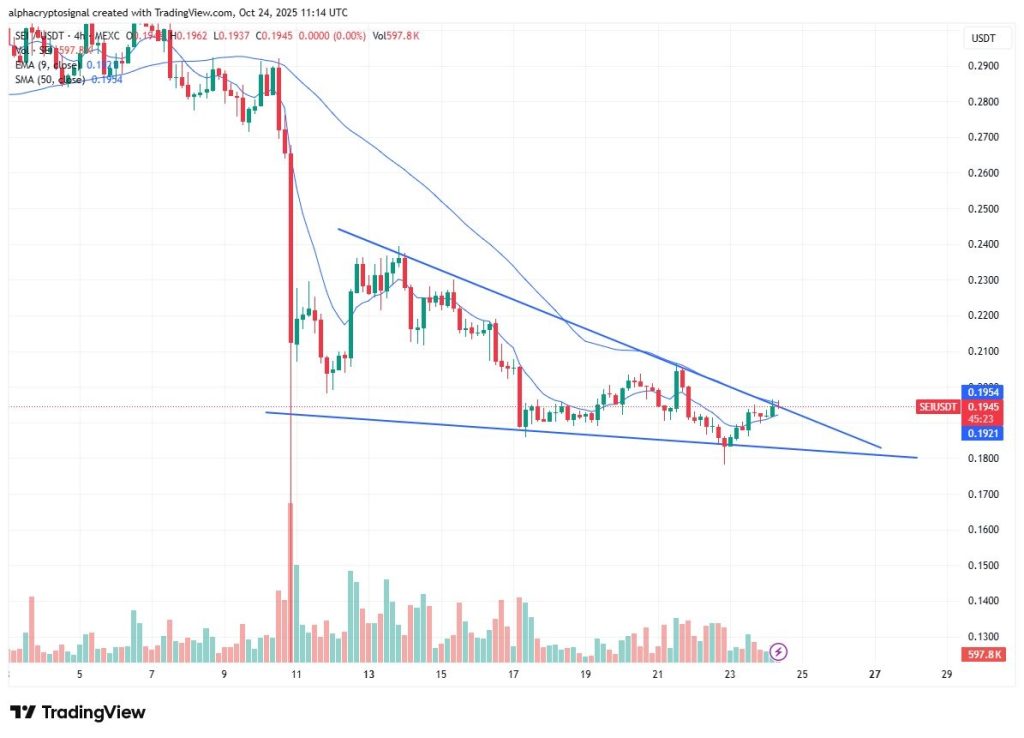
The real trigger will be a break and close above wedge resistance, ideally with strong trading volume. That would take SEI into the $0.205-$0.215 region, a range that coincides with the 0.5 Fibonacci retracement of the last major decline. A breakout there, tidy enough to register on the radar of momentum traders would likely to fuel the next uptrend.
Read Also: Key Indicator Flashes ‘Buy’ Signal for SEI, But You Might Want to Wait
Market Momentum and Trader Sentiment
Momentum indicators are showing the downtrend weakening. The 9-day EMA is flattening, and volumes are slowly increasing, both signs that the market may be preparing to turn.
Trader sentiment has been improving in recent days. The consensus is simple: if $0.185 holds, bulls stay in control. But if SEI price dips below that level, the pattern breaks down, and the bullish setup fails.
What Comes Next for SEI?
The SEI chart is showing classic reversal behavior, tight compression, higher reaction lows, and growing interest from traders. If the breakout happens above resistance, the price could rally toward $0.22 sooner than most expect.
For now, it’s all about patience and confirmation. SEI is building energy, and if buyers finally step in with volume, this wedge could turn into the next big breakout everyone’s watching.
Subscribe to our YouTube channel for daily crypto updates, market insights, and expert analysis.