
Shiba Inu has been locked in a downward channel, marking lower lows and lower highs over time. That long squeeze has now shaped into a symmetrical triangle, where pressure is building between falling resistance and rising support.
A chart shared by Butterfly on X shows SHIB pushing right at the edge of that structure. If SHIB token can hold during the ongoing retest, the setup could flip into a breakout that changes the direction of Shiba Inu price.
What the Chart Means for SHIB Price
A symmetrical triangle appears when highs trend lower and lows trend higher over time. The pattern on the 2-Day timeframe tightens across several months and points to a narrowing range. A breakout above the upper trendline would change the immediate technical picture for SHIB price.
A retest happens when price returns to the breakout line and holds, confirming that the break had substance rather than being a false move. Butterfly called that retest on the 2D timeframe a key validation step and noted signs of building momentum under the surface.
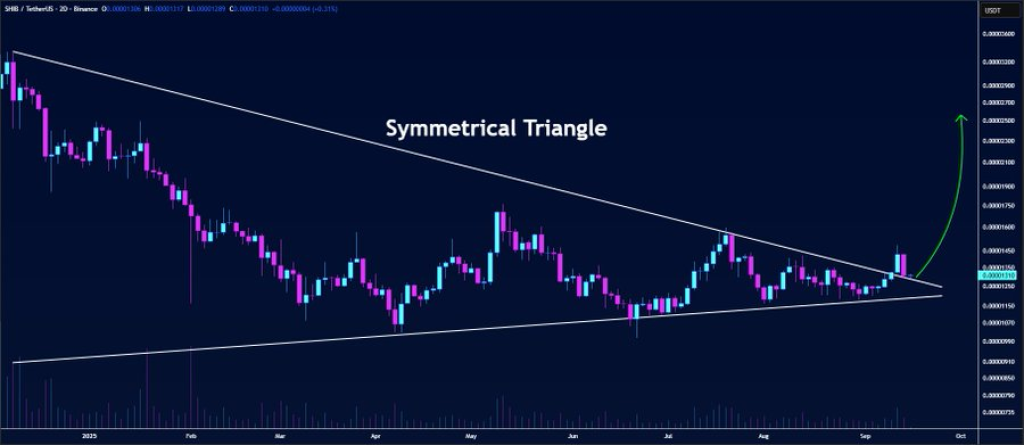
Symmetrical triangles can break either way, but in this case, a clean close above the top line gives a clearer bullish read. Price action earlier this year fell into a longer downtrend before the triangle emerged. That earlier move then gave way to a period of sideways action that carved the two converging trendlines.
A successful retest following this last breakout would mark a change from consolidation to directional momentum. Failure to hold the retest would bring attention back to the lower trendline as the next area of interest.
Read Also: Hedera Price Analysis – Here’s Why HBAR Is NOT Pumping
Keep an eye on how the next 2-Day candles behave around the triangle. Watching whether the retest holds and whether volume picks up will reveal much about the odds ahead.
Subscribe to our YouTube channel for daily crypto updates, market insights, and expert analysis.