Litecoin (LTC) Price Breaks Out As Global Liquidity Spike Hints at a Much Bigger Move Ahead – Is $150 Next?

Litecoin is back in the spotlight as two different charts are flashing bullish signals. One shows a clear breakout above a key resistance level, while the other highlights how Litecoin price is now moving in sync with global liquidity trends. Both of these updates were shared on X (formerly Twitter) by crypto expert Carl Moon and top analyst Bull Bear Spot, and they’re both pointing to the same idea: LTC could be gearing up for more upside.
Carl Moon, who has 1.5 million followers on X, said that Litecoin has broken out and even retested that resistance level, which is now acting as support. He believes this sets the stage for a potential move toward the $136 zone. Meanwhile, Bull Bear Spot took a broader view, comparing LTC price to global M2 liquidity and noting that the shift in money flow looks bullish for Litecoin going forward.
What you'll learn 👉
LTC Price Breakout Above $102 Support Shifts Structure
Litecoin daily price chart shows the token climbing above the $102–105 resistance zone, which had capped price action through February and March. After a rejection from the $78 support area in April, LTC staged a strong rebound and has now reclaimed the $100+ range.
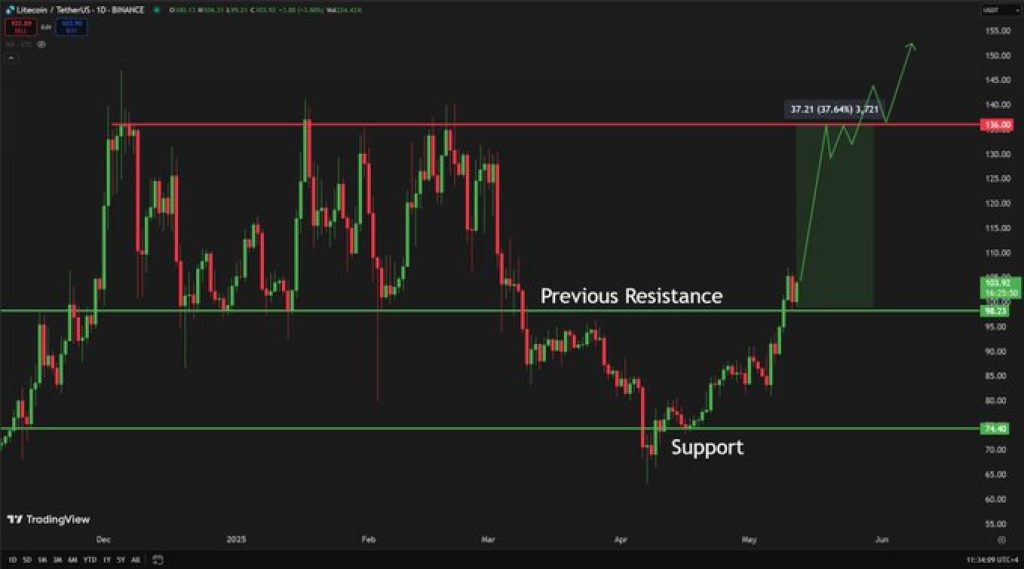
Litecoin price action shows a break from the descending pattern that defined the March–April period. Analysts now observe a pattern of higher lows forming, with $78 acting as the new bottom and $102 flipped into a support level. Should the token maintain structure above this range, the next potential resistance appears near $136, which previously served as a rejection point in December and February.
Read Also: Pi Coin Price Prediction for Today (May 13)
Global Liquidity Correlation Adds Fuel
Another chart shared by Bull Bear Spot presents a comparison between Litecoin candlestick structure and the yellow line representing M2 global liquidity. This overlay tracks the global money supply and is often viewed as a proxy for risk-asset inflows.
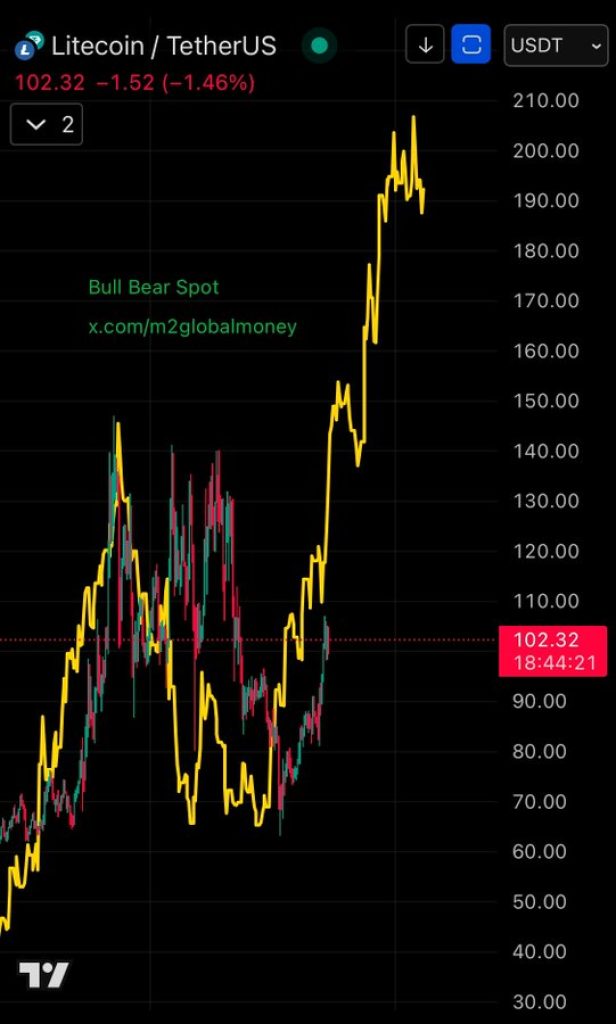
The chart shows that while Litecoin price lagged behind the M2 curve through the earlier stages, it has now begun moving in the same direction. The M2 line surged from the $60 range to above $190, suggesting increased global liquidity. Historically, such macro liquidity expansions have supported crypto price cycles.
Key LTC Price Levels and Short-Term Focus
Support levels remain defined at $78 and $90, with $102 being the immediate level to hold. Analysts watching this setup suggest that if Litecoin consolidates above $102 and maintains momentum, a move toward $130–$150 may follow.
The intersection of technical breakout patterns and favorable macro indicators places the Litecoin price in a zone of heightened market attention. Traders are monitoring whether the token’s breakout structure aligns with broader market liquidity flows.
Subscribe to our YouTube channel for daily crypto updates, market insights, and expert analysis.

We recommend eToro
Wide range of assets: cryptocurrencies alongside other investment products such as stocks and ETFs.
Copy trading: allows users to copy the trades of leading traders, for free.
User-friendly: eToro’s web-based platform and mobile app are user-friendly and easy to navigate.