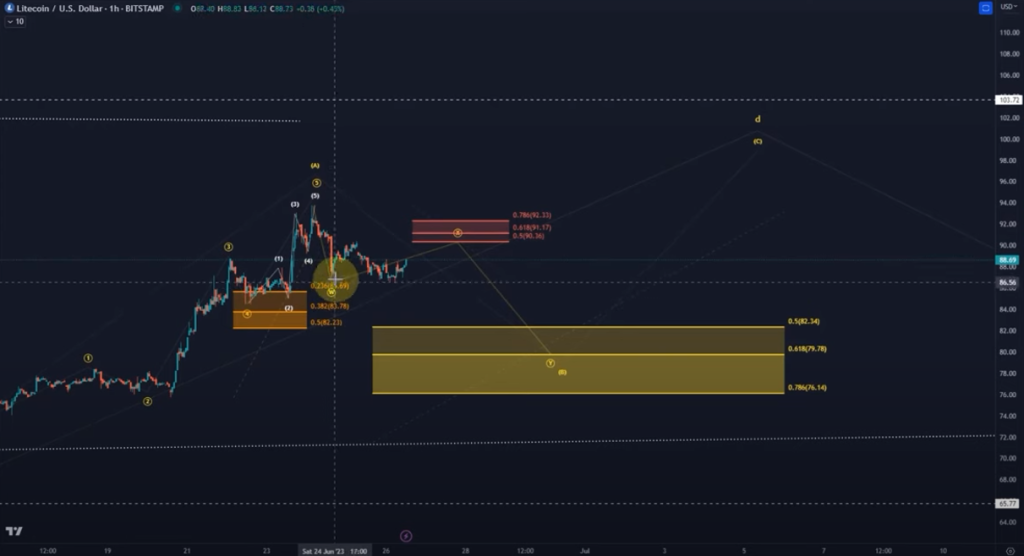
Litecoin stands as a beacon of reliability. Its chart patterns have been consistent, offering a sense of stability in an otherwise volatile market. Recently, Litecoin has completed a five-wave upward move, marking a significant milestone in its price trajectory. This completion signals the beginning of a corrective wave pattern, which typically consists of an A wave, a B wave, and a C wave.
The A wave, the first wave of the correction, has already been completed. The B wave, which is currently underway, is expected to pull back before the C wave propels the price higher. The B wave’s support is pegged between 76.82 and 82.30. This wave could unfold as a WXY structure, with the X wave potentially forming as a triangle or an ABC structure.
Doge2014 raises 500K in days celebrating Dogecoin. Make potentially big profits and get in on exclusive airdrop!
Show more +The X wave is crucial in determining the future price movement. If it exceeds the 78.6 retracement, it could signal a direct trend continuation to the upside. However, the ideal structure would be a WXY pattern in the B wave, with the X wave not exceeding the 78.6 retracement, followed by a sell-off in the Y wave.

Source: TradingView
Looking at the bigger picture, the current wave structure suggests that we are in the D wave of a larger triangle. This D wave comprises an ABC structure, and after its completion, a higher low is expected in the E wave before a breakout occurs. Alternatively, a direct breakout to the upside is also possible, with the signal for this being a break above the B wave high at 103.70.
While the trend for Litecoin is upward, it’s important to note that the 65.77 level is the invalidation point for the current wave structure. As long as this level holds, the focus can be on higher price levels. Whether Litecoin takes the route of a higher low in an E wave before moving higher, or it breaks out directly, the future looks promising for this cryptocurrency.
The technical analysis of Litecoin’s price suggests a positive outlook. The cryptocurrency’s chart patterns indicate a potential for growth, either through a higher low or a direct breakout. As always, it’s crucial for investors to stay updated and make informed decisions based on the latest data and market trends.
LINA Price Analysis: A Triangle Pattern Emerges
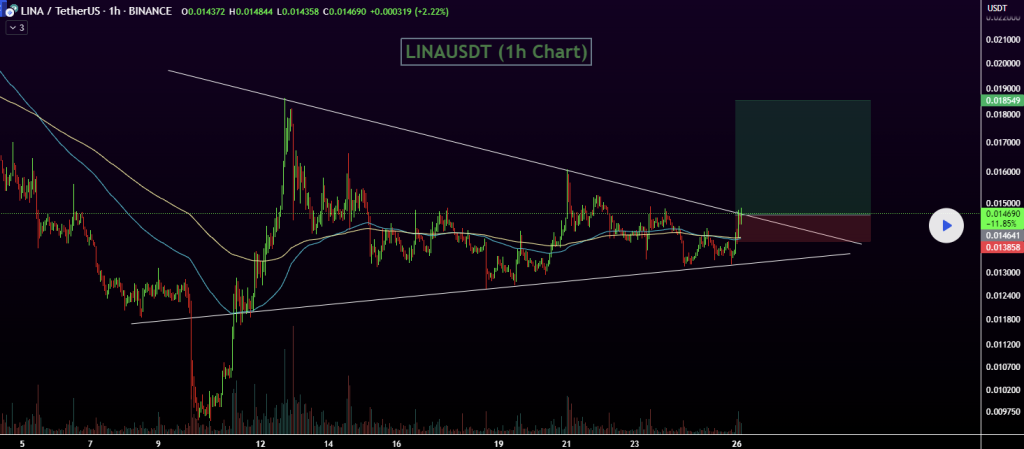
LINA has recently formed a symmetrical triangle pattern. This pattern is a significant indicator in technical analysis, often signaling a period of consolidation before a breakout occurs, either upward or downward.
The current technical analysis for LINA suggests specific buy, stop loss, and take profit levels. The recommended buy zone is below $0.0146. This is the price point at which investors might consider entering the market, expecting a future price increase.

Source: TradingView
The stop loss is set at $0.0139. The stop loss is a crucial risk management tool, designed to limit potential losses. If the price of LINA falls to this level, it may be advisable to sell to prevent further loss.
Three take profit levels have been identified: $0.0153, $0.0166, and $0.0186. These are the price points at which investors might consider selling their holdings to realize gains. These levels represent progressively higher targets, indicating optimism about LINA’s potential price increase.
However, as with all technical analysis, these predictions are not guarantees. Market conditions can change rapidly, and it’s essential to stay updated and make informed decisions based on the latest data and trends.


