
Litecoin has finally broken out again, and this chart shows it could be ready for the next leg up. A new chart shared by @CryptoKartha on X shows what looks like a strong breakout for Litecoin (LTC). According to him, the LTC price has already broken out of a bullish flag formation on the 4-hour chart and is now retesting that breakout level.
If this retest holds successfully, we could be looking at a quick 20 to 30% spike in the short term. His chart suggests a potential move from around $101 to just above $123, representing a clean 22% gain.
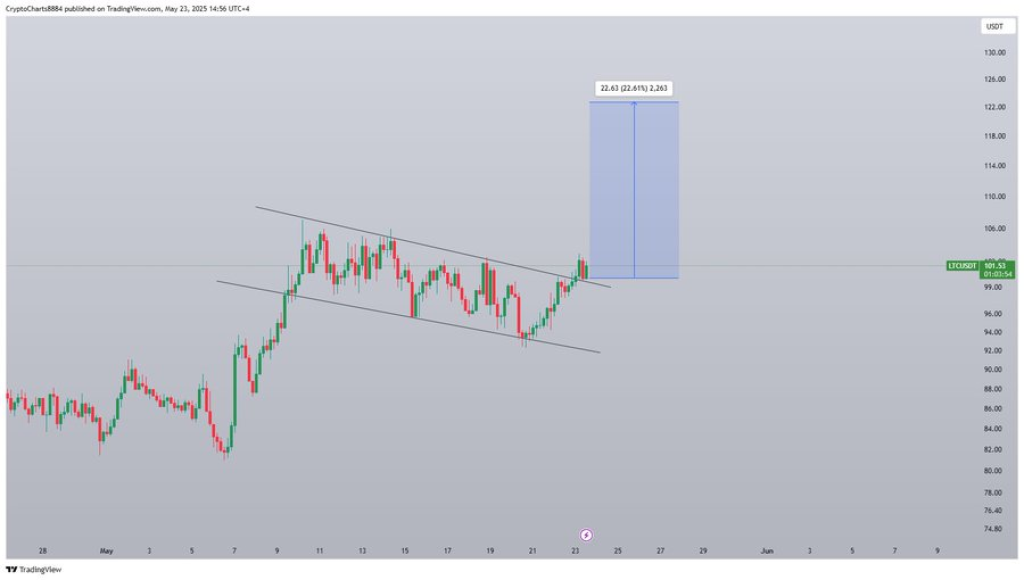
This pattern is significant because flag breakouts often act as continuation signals. The fact that Litecoin has exited the downward-sloping flag and is now consolidating above it shows strength. And if volume and momentum support this move, the breakout could turn into a strong rally.
What you'll learn 👉
Key Indicators Show Bullish Momentum for Litecoin Price
Most of the main trading indicators are aligning in support of this upward move. Below is a breakdown of current readings and what they tell us about the Litecoin chart:
| Name | Value | Interpretation |
|---|---|---|
| RSI (Relative Strength Index, 14) | 50.265 | This neutral reading means LTC is not overbought or oversold right now |
| STOCH (Stochastic Oscillator, 9,6) | 59.241 | Suggests a buy signal as momentum is shifting in favor of bulls |
| MACD (Moving Average Convergence Divergence, 12,26) | 0.11 | Another bullish signal as the MACD line is crossing above the signal line |
| Ultimate Oscillator | 56.554 | Momentum favors buyers and supports a potential continuation upward |
| ROC (Rate of Change) | -0.946 | Slight bearish momentum based on recent price changes, but very minor overall |
These readings mostly support a bullish bias. Although the Rate of Change (ROC) shows a tiny negative value, it doesn’t significantly outweigh the buy signals from the other indicators. Momentum remains with the bulls.
Moving Averages Back Up the Bullish Case
Moving averages offer more confirmation that Litecoin is in a strong technical position. The 50-day, 100-day, and 200-day moving averages are all flashing buy signals. Specifically, the LTC price is now above those key long-term averages, which usually indicates strong underlying strength and trend continuation. The only lagging signals are the 20-day moving averages, which are just slightly above or around current price levels, still catching up with the latest move.
In short, the longer-term momentum for LTC price is firmly upward. The fact that the LTC price is comfortably above the 100-day and 200-day marks is especially encouraging for swing traders and medium-term investors.
Read Also: Hedera (HBAR) to $1? Top Analyst Explains When and How It Could Happen
Final Verdict: Litecoin Price Looks Ready to Run
Everything is aligning nicely for Litecoin at the moment. The breakout from the bull flag is textbook. The retest is holding. Momentum indicators are turning bullish. And key moving averages are supporting the rally.
If @CryptoKartha’s chart plays out as expected, then the next few days could see LTC price hit $123 or more. A 20 to 30 percent rally is well within reach if market sentiment stays steady.
As always, this isn’t financial advice, but from a chart and technical perspective, Litecoin is clearly looking strong again.
Subscribe to our YouTube channel for daily crypto updates, market insights, and expert analysis.

We recommend eToro
Wide range of assets: cryptocurrencies alongside other investment products such as stocks and ETFs.
Copy trading: allows users to copy the trades of leading traders, for free.
User-friendly: eToro’s web-based platform and mobile app are user-friendly and easy to navigate.