
Litecoin price might be hitting a turning point after a key technical signal hinted at a possible short-term pullback. On the 3-day chart, the TD Sequential indicator just flashed a rare sell signal, according to crypto expert Ali. This comes after a strong rally that pushed LTC from under $70 to above $105 in just a few weeks.
Right now, Litecoin is trading around $100.33, showing a 3% gain over the past day. Martinez shared in a tweet that the signal could mean a correction is coming soon, especially with LTC sitting near a major resistance zone that has held the price back before.
What you'll learn 👉
Sell Signal Appears as Litecoin Price Hits Fibonacci Resistance
The TD Sequential indicator is widely used to identify trend exhaustion. On Litecoin 3-day chart, the “9” count that triggered aligns with a rejection near the 1.0 Fibonacci extension level, around $105.86. That area acted as short-term resistance, confirmed by a bearish candlestick after price tested this level.
Price action shows that LTC price previously climbed steadily, forming higher highs and higher lows over several sessions. The move brought Litecoin to test and reject the 1.0 Fibonacci zone, which now stands as immediate resistance.
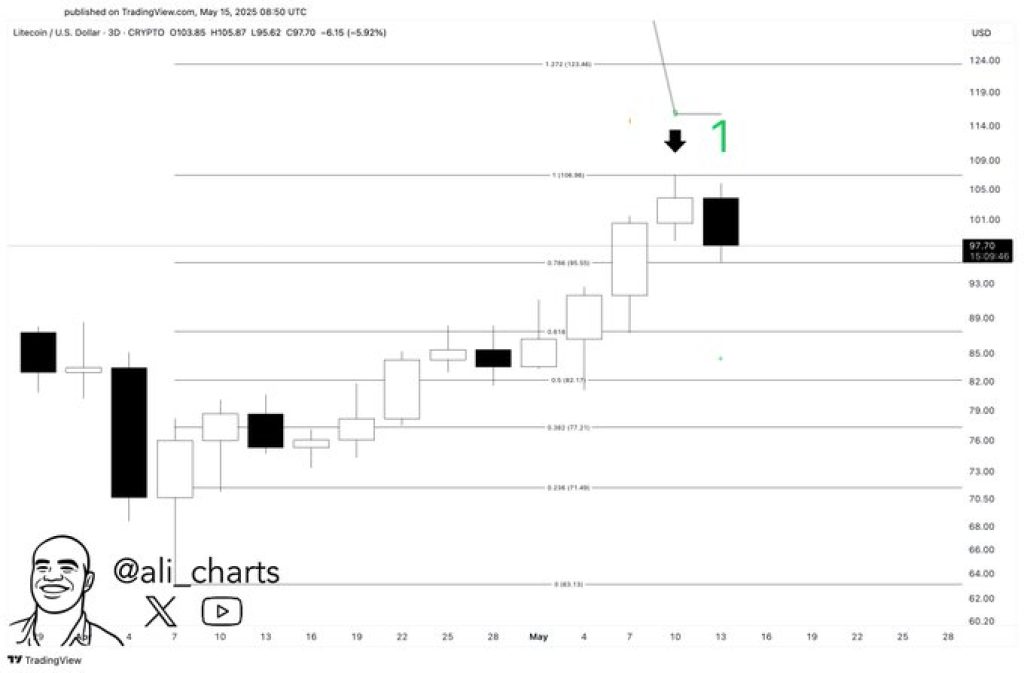
Moreover, if Litecoin fails to maintain current levels, several Fibonacci retracement zones could serve as support. The nearest support lies at $94.60, followed by $89.17. These levels coincide with the 0.618 and 0.5 Fibonacci retracement points, respectively.
A deeper pullback may target the $83–$90 area, where a cluster of Fibonacci levels formed during the previous accumulation phase. This zone could attract buying interest if the correction extends.
Litecoin Momentum Slows but Trend Structure Remains Intact
While the TD Sequential signal suggests caution, the broader market structure for Litecoin price remains intact. As long as the price stays above the key support levels, the uptrend may resume.
Analysts and traders are watching how LTC behaves near the $94–$100 region. A strong hold above these zones may provide the foundation for another push toward the $114.46 extension level. Until then, the current bearish signal introduces a short-term watch period.
Litecoin (LTC) Technical Setup Aligns with Analyst’s Warning
The chart shared by Ali outlines a clean Fibonacci framework for Litecoin recent breakout. The confluence of technical resistance and the TD Sequential “9” count brings attention to possible trend fatigue. The market is testing current support levels, which could lead to more price swings soon.
The next few trading days will likely decide if Litecoin price drops further or finds stability and starts climbing again.
Read Also: Onyxcoin (XCN) Is Pumping: Here’s What Just Triggered the Surge
Subscribe to our YouTube channel for daily crypto updates, market insights, and expert analysis.

We recommend eToro
Wide range of assets: cryptocurrencies alongside other investment products such as stocks and ETFs.
Copy trading: allows users to copy the trades of leading traders, for free.
User-friendly: eToro’s web-based platform and mobile app are user-friendly and easy to navigate.