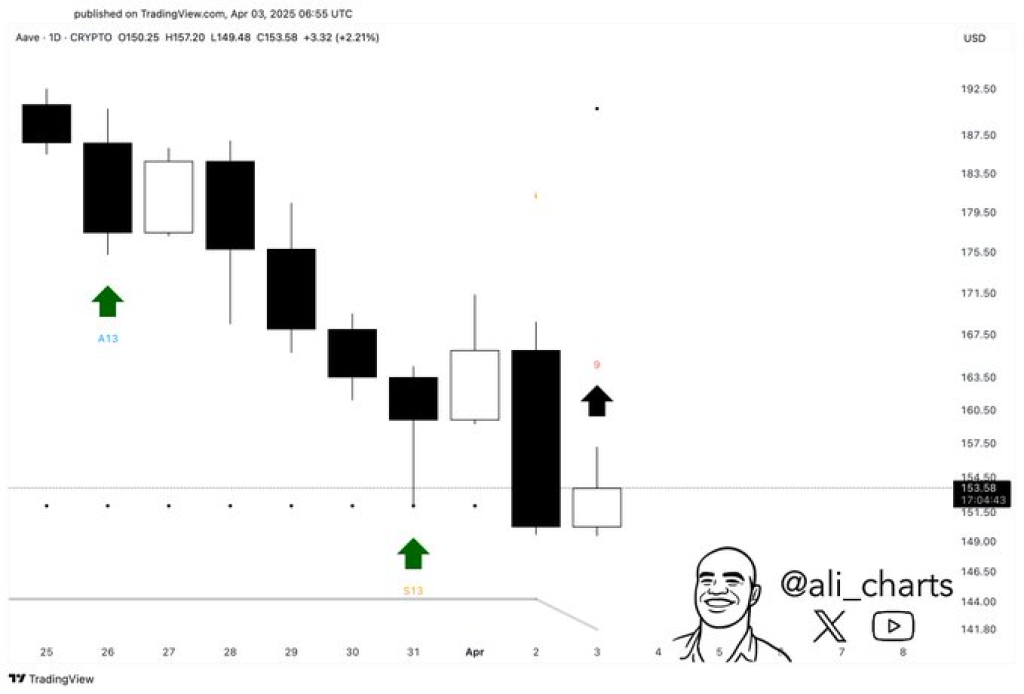
AAVE may be showing early signs of a potential price shift. Crypto expert Ali posted on X (formerly Twitter) that a key metric has issued a buy signal for the token. The accompanying daily chart revealed a notable technical pattern that suggests momentum may be changing after a period of sustained downward movement. At writing, AAVE price sits at $150.38.
The chart shared depicts daily candlestick patterns for AAVE alongside price action and TD Sequential data. The presence of a green “13” on the chart points to a completed buy setup, which is historically known to indicate a trend change or pause in downward momentum.
What you'll learn 👉
AAVE Technical Setup Signals Potential Reversal
The chart shows that AAVE price dropped steadily from March 25 through April 1, with several red candles in a row. During this time, sellers kept pushing the price down toward an important support area between $148 and $150.
On April 1, there was a big red candle, followed by a white candle the next day. This white candle had a small body and showed hesitation from sellers. April 3 brought another white candle, but with a long lower wick, reflecting buying pressure at lower levels.
The combination of these signals, particularly the green “13” from the TD Sequential, suggests the downtrend may be losing strength. Such signals often precede short-term price recoveries or a period of consolidation..

AAVE Support and Resistance Levels to Monitor
The price of AAVE appears to have found a support base in the $148–$150 range, which aligns with previous price rejections and the recent buy signal. This level could serve as a foundation if bullish sentiment continues.
On the upside, the token faces resistance near $163–$165. This was a previous price zone where buyers struggled to maintain momentum. If AAVE can break this barrier, the next resistance level is expected around $170–$175, a range tied to earlier consolidation periods.
Furthermore, Ali’s tweet brought attention to the technical setup. The market reacted with moderate upward movement, but volume data was not provided in the chart.
Traders may look for confirmation in the form of stronger bullish candles or a break above resistance. Without this, the current move could remain a temporary bounce. The coming days will be key in determining whether the price of AAVE can build on this signal and initiate a broader recovery through April.
Subscribe to our YouTube channel for daily crypto updates, market insights, and expert analysis.
We recommend eToro
Wide range of assets: cryptocurrencies alongside other investment products such as stocks and ETFs.
Copy trading: allows users to copy the trades of leading traders, for free.
User-friendly: eToro’s web-based platform and mobile app are user-friendly and easy to navigate.


