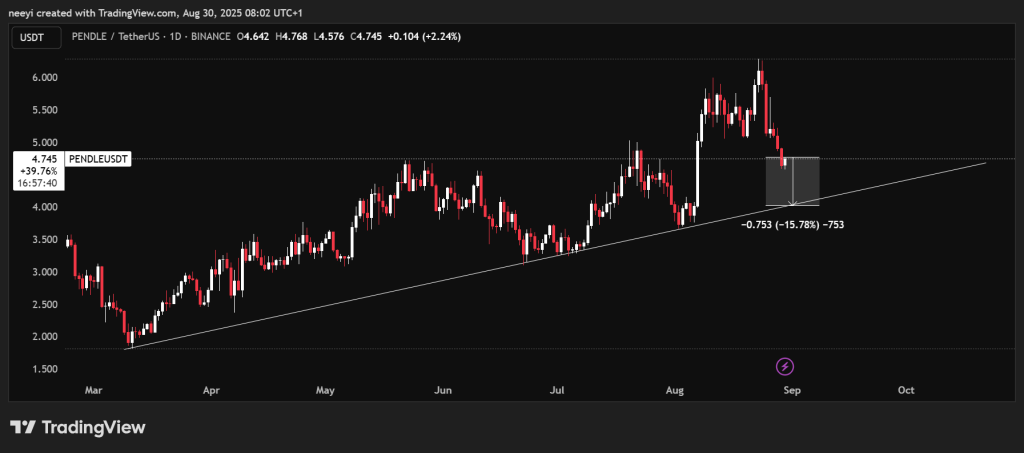
Crypto analyst Ali posted that the TD Sequential indicator flashed a buy signal for Pendle price on the 12-hour chart. That type of reading often suggests a possible rebound after a sharp decline. At first glance, it looks like a good setup for buyers hoping for a bounce.
Still, looking deeper at the charts, the picture may not be as simple as a straightforward recovery. PENDLE has been sliding for some days, and while a short-term bounce could happen, the broader trend shows room for caution.
TD Sequential flashes buy on $PENDLE, rebound setup in play! pic.twitter.com/VPsCCeFBD7
— Ali (@ali_charts) August 30, 2025
A Closer Look at the Trendline Support
On the daily chart, Pendle price has been moving within a clear uptrend since March. Each time the price pulled back, it bounced off the rising trendline and then moved higher. This is a common technical pattern where buyers step in at familiar support zones.
Right now, Pendle is trading around $4.7, but the trendline sits a little lower. That means the price could still fall by another 15% before touching that support. If history repeats itself, that area may attract buyers again, but until then the risk of further downside is still on the table.

The chart also shows how steep the recent drop has been. The rebound many are expecting might only come once that support is tested again. Traders who jump in too early could find themselves stuck in a losing position if the decline continues.
What the Indicators Are Saying About PENDLE
Beyond the price action, momentum indicators on the daily chart paint a mixed but cautious picture.
| Name | Value | Action |
|---|---|---|
| RSI (14) | 43.962 | Sell – momentum is weak and leaning toward oversold conditions |
| STOCH (9,6) | 21.827 | Sell – showing bearish momentum and little strength in recovery attempts |
| MACD (12,26) | 0.058 | Buy – signals a possible rebound attempt, but still shallow |
| ROC | -12.881 | Sell – price velocity is negative, pointing to continued weakness |
The takeaway is that while the MACD hints at a possible short-term bounce, three other major indicators lean bearish. The RSI sits below 50, the Stochastic is deep in bearish territory, and the Rate of Change confirms downward pressure. This creates a warning sign that the “buy” signal may not be as strong as it looks in isolation.
Pendle price chart tells two stories at once. On one side, Ali’s TD Sequential signal points to a rebound setup. On the other, the longer-term trendline and technical indicators suggest the market could still push lower before finding real support.
Read Also: BlackRock to File for Hedera ETF? What It Could Mean for HBAR
This doesn’t mean Pendle is doomed, since past bounces from the trendline show there is strong demand waiting at lower levels. It just means that timing matters. A buy signal at $4.7 may be tempting, but patience could offer a better entry if the price dips closer to the long-term support.
Subscribe to our YouTube channel for daily crypto updates, market insights, and expert analysis.


