Key Indicator Just Flashed a “Buy Signal” for Polkadot – Could DOT Price Be Ready to Rebound?

Crypto expert Ali just shared an interesting update on Polkadot (DOT), and it’s got some traders paying closer attention. On the 4-hour chart, the TD Sequential indicator has just hit a “9”, a level that often hints at a potential price reversal. With DOT price bouncing between $3.42 and $3.75 lately, this setup could be signaling that a shift in momentum is coming.
Right now, DOT is sitting near a key support level around $3.51. According to Ali’s tweet, this might be the setup for a short-term rebound. His chart even highlights the signal with a bold black arrow pointing up, a visual cue that a bounce could be on the way if buyers step in.
Moreover, the TD Sequential is a popular tool among traders looking to catch trend shifts early, and if this one plays out, it might offer a quick upside move. Still, whether Polkadot price moves higher or breaks down further depends on what happens next in the chart.
What you'll learn 👉
Polkadot Price Trend and Consolidation Behavior
DOT has been on a clear downward path, forming lower highs and lower lows in recent sessions. However, recent candles show smaller price movement and reduced volatility, which could point to consolidation around current levels. This often precedes a breakout in either direction.
Polkadot price action near the $3.51 level appears to be forming a base. A small bounce attempt is visible, though not yet confirmed by volume or a break of structure. If the buying setup leads to increased interest, short-term resistance levels around $3.60–$3.65 may come into focus.
Polkadot Key Levels and Chart Structure
A descending trendline on the chart continues to act as resistance, capping each recovery attempt. For a shift in trend, DOT price would need to close above this line with strong follow-through. Until then, the market remains within a bearish structure.
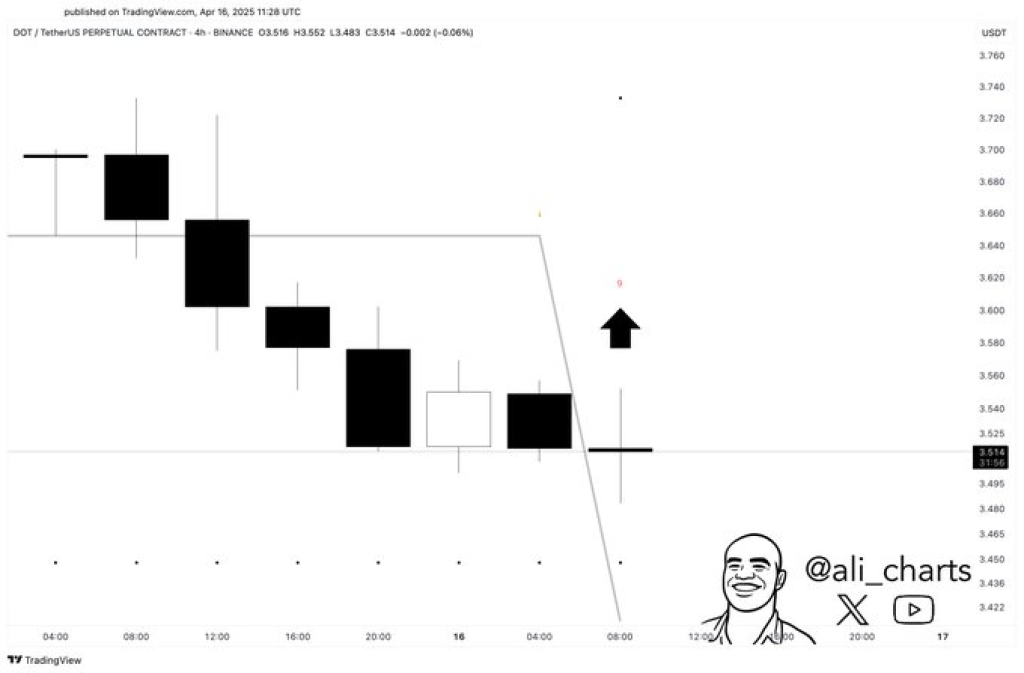
Support at $3.51 has held so far, but a clear close below it could open the path toward $3.42, the next possible demand zone. Traders are monitoring both zones closely, as these levels could determine short-term direction.
Read Also: Should You Throw $1,000 Into Hedera Right Now? HBAR Price Outlook
DOT Market Reaction and What to Monitor
While the TD Sequential signal offers a potential catalyst for change, confirmation will depend on how the next few candles close. The signal alone is not a guarantee, but it can serve as an early alert for technical traders.
Price behavior near the $3.51 level, interaction with the descending trendline, and volume levels will be watched closely. A move through the trendline could attract momentum traders, while a drop below support may trigger further selling pressure.
As of the latest data, DOT price is trading at $3.52 with muted intraday movement. Traders and analysts remain focused on whether this buy setup will hold or fade under resistance.
Subscribe to our YouTube channel for daily crypto updates, market insights, and expert analysis.

We recommend eToro
Wide range of assets: cryptocurrencies alongside other investment products such as stocks and ETFs.
Copy trading: allows users to copy the trades of leading traders, for free.
User-friendly: eToro’s web-based platform and mobile app are user-friendly and easy to navigate.