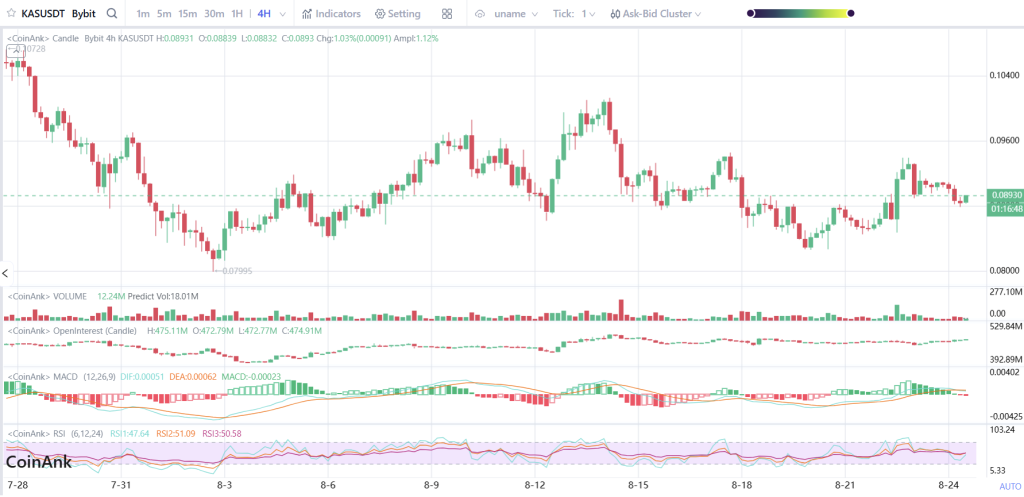
Kaspa has been moving quietly around the $0.089 zone, showing only small swings after bouncing from its local bottom at $0.0799 earlier this month. The token has been stuck in a sideways pattern, and the indicators now give us a clearer picture of what could be next.
What you'll learn 👉
Price Movement
Looking at the 4H chart, Kaspa has been in a choppy consolidation. Each attempt to push above $0.095 has been met with selling, while the $0.085–$0.087 range has acted as strong support. This tight range indicates traders are waiting for a bigger move before committing.
Open Interest
Open interest is sitting close to $475M, slightly higher than last week. This shows that positions are slowly building up again. More open interest often means the next move will be sharp, as both bulls and bears load up and prepare for volatility.
Volume
Daily trading volume remains muted at around 12M, far below the spikes we saw earlier in August. This low activity fits the consolidation pattern, as most traders are waiting for confirmation before jumping in. A sudden jump in volume will likely be the first signal of the breakout direction.
Read also: Is Binance Preparing to List Kaspa? Here Are the Clues
MACD
The MACD is flat and hugging the zero line. Momentum has cooled off, and there’s no strong bullish or bearish signal at the moment. However, the histogram is showing smaller red bars, which could hint at weakening selling pressure. If the MACD line crosses back above signal, it could support a push toward $0.095.
RSI
The RSI is sitting just above 50, showing neutral momentum. Kaspa isn’t overbought or oversold, which leaves plenty of room for a move in either direction. For now, it confirms the sideways action we’ve been seeing.
Kaspa Price Prediction for Next Week
If Kaspa holds above $0.087 and volume picks up, the price could attempt another run toward $0.095 and possibly $0.10. Breaking that level would open the door for $0.105–$0.11. On the downside, if support at $0.085 gives way, we could see a drop toward $0.080 again, where buyers have stepped in before.
For now, Kaspa looks like it’s coiling up. The tight range and neutral indicators suggest that the next week could be decisive, with $0.087 as the key support and $0.095–$0.10 as the ceiling to watch.
Subscribe to our YouTube channel for daily crypto updates, market insights, and expert analysis.