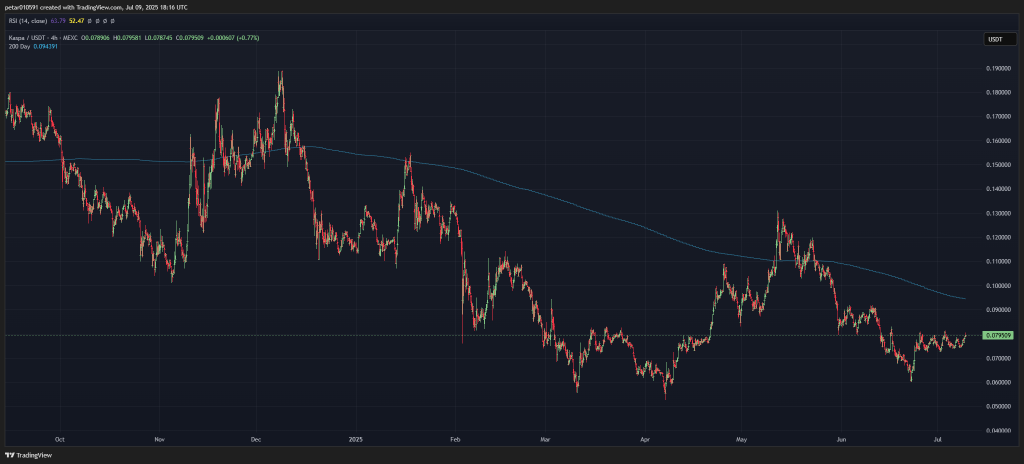
Kaspa (KAS) is slowly showing signs of recovery after a long stretch of downward movement. The token is now trading around $0.079, trying to build a short-term base. Even though it hasn’t broken out yet, buyers are starting to step in at key levels, and some technical signals are starting to lean in their favor.
Let’s break down what’s going on with Kaspa’s chart right now.
Kaspa has been moving sideways for the past few weeks, but it’s managed to stay above its most recent bottom near $0.065. Since then, price has bounced and is now hovering just below a resistance zone around $0.080–$0.082. This level has been tough to break before, and once again, it’s slowing down the upward move.
If Kaspa can push above that level and turn it into support, the next price target could be between $0.088 and $0.090. That’s where it last got rejected during a brief bounce in early June.
On the downside, support around $0.074–$0.075 has held well over the last two weeks. That area has seen multiple bounces and could act as the short-term floor. If that breaks, the next big demand zone sits lower, around $0.065–$0.067 – the same level that triggered the latest rebound.
200-Day Moving Average Still Acts as a Ceiling
Looking at the bigger picture, Kaspa is still trading below its 200-day moving average. That line is currently sitting at $0.094, and it has been pointing down for months. Kaspa hasn’t been able to get above this moving average since early March, and it continues to act as long-term resistance.
Until price reclaims that level and closes above it, most traders will stay cautious. A strong break and close above the 200-day MA could open the door for a move toward $0.100 or higher, but we’re not there yet.
For now, Kaspa is still stuck below that trendline. But as long as it keeps printing higher lows, the structure is slowly shifting in favor of buyers.
Momentum has picked up slightly. The 4-hour RSI is sitting around 63, showing that bulls are in control for now, but it’s not overbought yet. This means there’s still room for the price to run before hitting any serious momentum resistance.
There’s no bearish divergence on the RSI right now, which is a good sign. The current bounce also looks healthier than the last one in late May, which failed quickly.
What the market needs now is confirmation. A strong 4-hour or daily candle close above $0.080–$0.082, backed by volume, could signal the start of a proper breakout. Until then, Kaspa remains in a short-term consolidation range.
Read also: Hedera (HBAR) or Kaspa (KAS): Which Crypto Could Explode in 2025?
Short-Term Kaspa Price Prediction
Kaspa’s price action over the past few weeks indicates that buyers are defending key support zones. The most important level right now is $0.075. If the price stays above that, there’s a good chance we’ll see another attempt at the $0.080 resistance.
If that level breaks, the next move could take KAS up to $0.090, possibly even testing the 200-day MA near $0.094. But if price gets rejected again and drops below $0.075, it could revisit the $0.065 zone.
In short, the bounce is real, but the breakout hasn’t happened yet. Kaspa is holding steady, showing strength at support, and building a base. But bulls still have work to do.
Subscribe to our YouTube channel for daily crypto updates, market insights, and expert analysis.