Kaspa is waking up, and the chart is starting to look interesting again. After spending weeks stuck in a downtrend, the price is now pressing up against a key resistance zone.
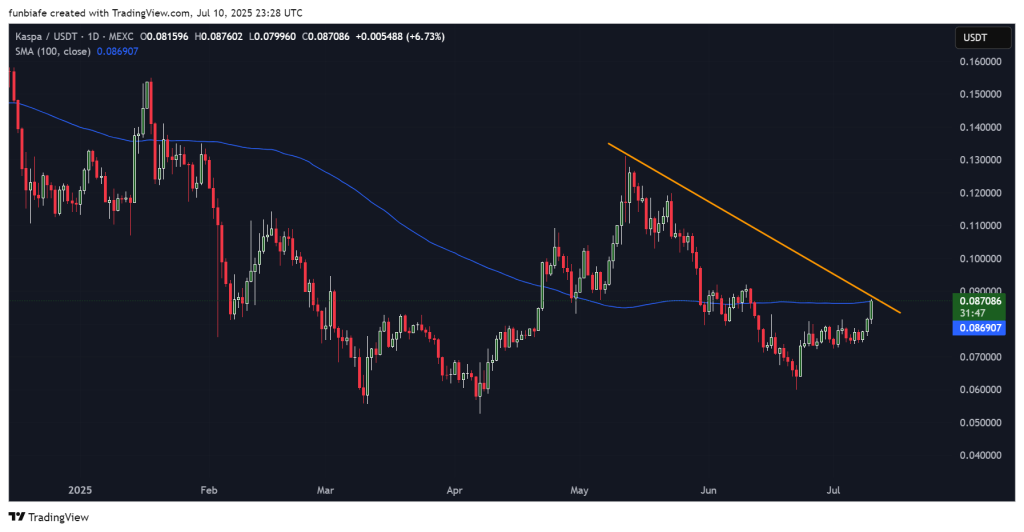
KAS just printed a daily candle, closing at $0.08708, up nearly 7% on the day, and it’s testing both a trendline and its 100-day moving average at the same time.
That $0.088 to $0.090 range has rejected KAS price before, but this time, bulls are coming in stronger. Let’s break down what’s happening with KAS today.
What you'll learn 👉
📅 What We Got Right Yesterday
In yesterday’s prediction, we noted that if KAS held the $0.080 support, we’d likely see a move toward $0.09.
That’s pretty much what happened. Buyers stepped in, defended $0.080, and now Kaspa price is knocking on the door of a key resistance zone.
We also mentioned that failure to hold $0.080 could send it back into the old sideways range between $0.072 and $0.078. So far, bulls are holding the line, but the real test is happening right now at the trendline.
📊 Kaspa Daily Snapshot (July 11)
- Current Price: $0.0870
- 24h Change: +6.73%
- 100 SMA: $0.0869 (now acting as dynamic support)
This is the first time in a while that KAS price has traded above its 100-day moving average and that’s a big deal for trend watchers. It means buyers are starting to gain control, but they still need to break above that orange downtrend line that’s been pushing price lower since May.
🔍 What the Kaspa Chart Is Showing
Kaspa chart shows a descending wedge or triangle pattern, and the price is right at the edge of breaking out. The 100-day SMA is acting like a launchpad here.
If the price can close above $0.090, we could be looking at a clean breakout. The next major resistance after that? Around $0.10 to $0.108.
But here’s the catch: this is a “make or break” moment. If KAS price fails to break through that trendline, it could pull back and test $0.080 or even $0.075 again.
📈 Technical Indicators (Daily Timeframe)
| Indicator | Value | Signal / Interpretation |
| RSI (14) | 60.88 | Bullish momentum, not yet overbought |
| MACD (12,26) | -0.001 | Mild bearish crossover, lagging confirmation |
| CCI (14) | 330.52 | Overbought, risk of short-term pullback |
| Ultimate Oscillator | 65.31 | Bullish trend strength |
| ROC (Rate of Change) | 18.05 | Strong upward momentum |
| Bull/Bear Power (13) | 0.0119 | Slight bullish bias |
Summary: Momentum indicators support further upside, though CCI warns that KAS may be temporarily overbought. MACD remains slightly bearish, which may reflect past weakness rather than current strength.
🔮 Kaspa Price Prediction Scenarios
Bullish Scenario:
A close above $0.090 on a daily basis can confirm the breakout, with the next target at $0.10 to $0.108.
Neutral Scenario:
If price gets stalled at $0.088–$0.090, KAS price may build between $0.080 and $0.090 in anticipation of more momentum.
Bearish Scenario:
A rejection at trendline resistance followed by a move below $0.080 could return price to the $0.072–$0.078 range.
Read Also: Hedera (HBAR) or Kaspa (KAS): Which Crypto Could Explode in 2025?
🧠 Wrapping Up
Kaspa price is at a risky point as it tests a level of resistance while trading above its 100-day SMA. Bulls prefer momentum, but overbought levels indicate a reversal or retest.
The outcome of the current session should decide whether KAS shoots higher towards $0.10 or drops back into range-bound action below $0.080.
Subscribe to our YouTube channel for daily crypto updates, market insights, and expert analysis.