

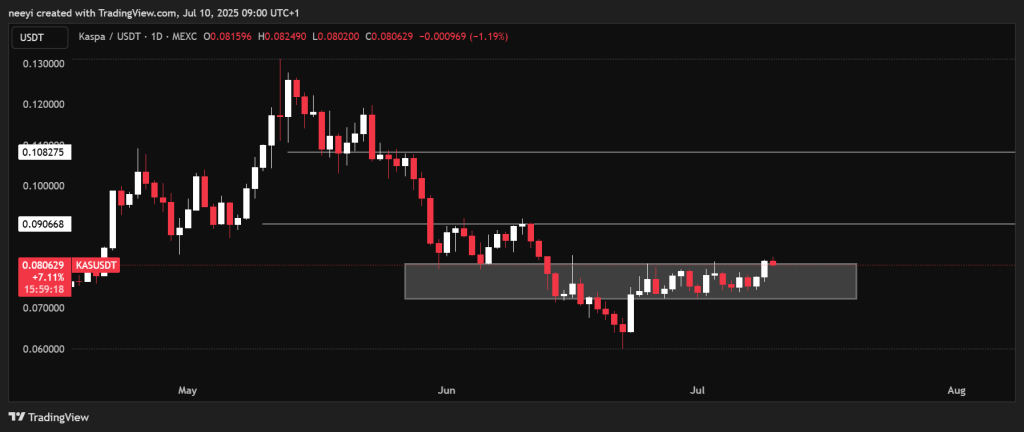
To understand where Kaspa price could be heading today, we first need to look at the broader structure on the chart. Over the past 17 days, KAS price has been stuck in a tight range, moving sideways between $0.072 and $0.08. But something changed on Wednesday. Kaspa price finally broke above this consolidation range, closing higher and suggesting a potential trend shift is underway.
The next step is confirmation. If today’s price action sees KAS successfully retesting the $0.08 zone and bouncing, then we could be looking at a rally toward $0.09 and possibly $0.108 in the short term. However, if the retest fails and price dips back into the previous range, it may mean more days of sideways movement.
What you'll learn 👉
What the Hourly Indicators Say About KAS Price
According to Investing.com, here’s what some of the key technical indicators are saying right now about the KAS price trend:
| Name | Value | Explanation |
|---|---|---|
| RSI (14) | 59.549 | This shows moderate strength. It’s not overbought yet, so there’s still room for an upward move. |
| STOCH (9,6) | 51.145 | This is right in the middle, meaning momentum is currently balanced. No strong push yet. |
| MACD (12,26) | 0.001 | The MACD is slightly above zero, suggesting mild bullish momentum. |
| ADX (14) | 43.59 | A high ADX like this signals a strong trend is forming, but it doesn’t tell direction. |
| ATR (14) | 0.0009 | Low ATR means volatility is currently subdued, so price moves may not be dramatic. |
| Ultimate Oscillator | 54.572 | This shows mild buying pressure, but it’s still a cautious reading. |
These indicators combined suggest Kaspa may be entering a bullish phase, but it needs a bit more confirmation from price action.
What the Moving Averages Say About KAS Price
Looking at the moving averages gives more context about short and long-term trends. Both the 5-day and 10-day simple moving averages are giving sell signals, meaning KAS price is currently trading below these short-term lines. However, the exponential MA for 10 days has flipped to a buy, showing a subtle shift in momentum.
More clearly, both the 20-day and 50-day moving averages are flashing buy signals. This means that from a medium-term perspective, the trend is turning positive. When short-term resistance breaks and aligns with medium-term support, it often leads to sustained rallies.
So, while the very short-term trend is still undecided, the longer timeframes suggest a strengthening bullish structure is forming for Kaspa.
Kaspa Price Prediction for Today
If KAS price successfully retests the breakout zone around $0.08 and holds that level as support, then a push to $0.09 is likely in the next 24 hours. Beyond that, $0.108 is the next big resistance level to watch.
Read Also: Hedera (HBAR) or Kaspa (KAS): Which Crypto Could Explode in 2025?
But on the flip side, if the retest fails and KAS price falls back below $0.08, it may slip back into the previous range and keep trading sideways between $0.072 and $0.08.
In summary, today’s prediction hinges on the outcome of the retest. A bounce from $0.08 could open the door for bullish continuation, while a drop back inside the range might delay the rally.
Subscribe to our YouTube channel for daily crypto updates, market insights, and expert analysis.


