
Kaspa Price Hits Decision Zone as Exchange Outflows Surge – Here’s What the KAS Chart Tells Us

Kaspa (KAS) is grabbing a lot of attention right now as it inches closer to that $0.12 resistance level. At the same time, big exchange outflows and a rising market cap are hinting that investor sentiment might be shifting.
Over the past day, Kaspa saw more than $250 million in spot trading volume and over $500 million in derivatives activity, pretty solid numbers. According to updates from KaspaDaily on X, the momentum is still strong, but there’s a big pocket of buy orders sitting much lower on the chart that could come into play if the price loses steam.
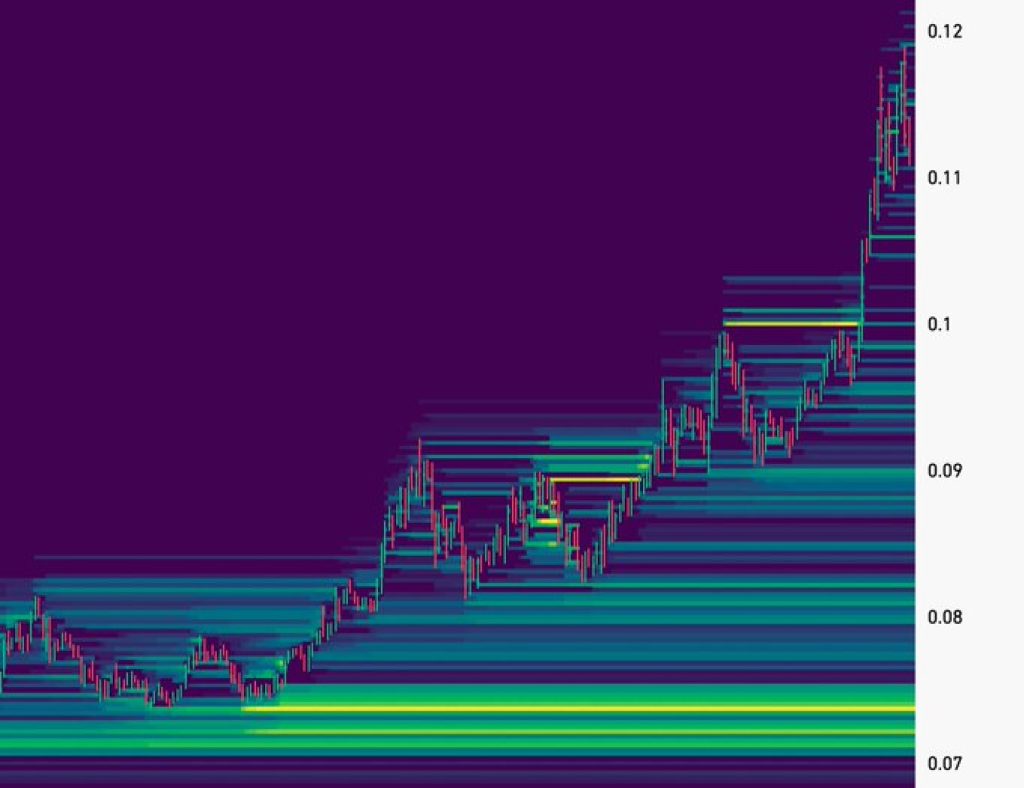
Looking at the heatmap, Kaspa price been climbing steadily from around $0.07 up toward $0.12, breaking out cleanly from each consolidation zone along the way. It’s been following a nice bullish pattern with higher highs and higher lows. But now, $0.12 is acting as a bit of a roadblock.
There isn’t a lot of sell pressure sitting just above that level, which means if buyers keep showing up, we could see a quick move higher. On the flip side, if the rally slows down, the price might slide back toward earlier support zones before making another attempt.
What you'll learn 👉
Kaspa Liquidity Cluster Between $0.07–$0.075 Remains Unfilled
According to Kaspa Daily, a major cluster of resting buy orders remains between $0.07 and $0.075. While this zone is distant from the current price, it could become relevant if momentum weakens or if the broader market undergoes correction.
Liquidity at this level represents buyer interest accumulated over time. Such clusters often act as magnets in slower markets, drawing prices downward to fill pending orders. Still, in strong uptrends, these zones are sometimes left untouched as price continues to advance.
Read Also: Here’s the XRP Price if Amazon Starts Using Ripple for Daily Payments
KAS Price Trading Volume and On-Chain Behavior Support Trend
In a separate update, Kaspa Daily reported that Kaspa’s trading activity is surging. With $3 billion in total market capitalization and high participation from both spot and derivatives markets, volume supports the current trend structure.
Kaspa Trading Volume Surges Amid $3B Market Cap
— Kaspa Daily (@DailyKaspa) July 22, 2025
Kaspa recorded $250M in spot volume and over $500M in derivatives volume in the past 24 hours – signaling heightened market activity.
With its market cap now around $3 billion, Kaspa is drawing growing attention from both retail… pic.twitter.com/nWvXpWhf7n
Kaspa Daily also noted that approximately 50 million KAS tokens departed centralized exchanges such as Gate.io, KuCoin, and MEXC. The outflow removes sell-side pressure, indicating a shift towards longer-term holding behavior among investors.
Kaspa Sees Major Exchange Outflows
— Kaspa Daily (@DailyKaspa) July 22, 2025
Around 50 million Kaspa left Gate .io, KuCoin, and MEXC yesterday, signaling heightened accumulation activity.
Kaspa supply on exchanges remains at some of the lowest average levels since December 2024, suggesting reduced sell-side pressure… pic.twitter.com/dZmF0v2xji
KAS Support Levels Offer Context for Retracement
Should Kaspa price fail to break $0.12 on the first attempt, several support zones are visible. The $0.10 and $0.09 levels have served as past consolidation areas and could act as re-entry points. These zones are marked by smaller liquidity concentrations but remain structurally relevant within the ongoing uptrend.
If a deeper correction occurs, the $0.07–$0.075 zone would likely serve as the final base before renewed accumulation. For now, traders are watching the $0.12 breakout attempt closely as the next move could determine short-term direction.
Subscribe to our YouTube channel for daily crypto updates, market insights, and expert analysis.


