Kaspa price has been pretty quiet lately after making some huge moves earlier this year. It ran up past $0.20 few months back. Since then, the momentum has cooled, and now KAS is trading around $0.085 as we wrap up August.
Traders are watching closely to see if this level turns into a solid base or if the price is headed lower before the next leg up.
What you'll learn 👉
What the KAS Chart Is Showing
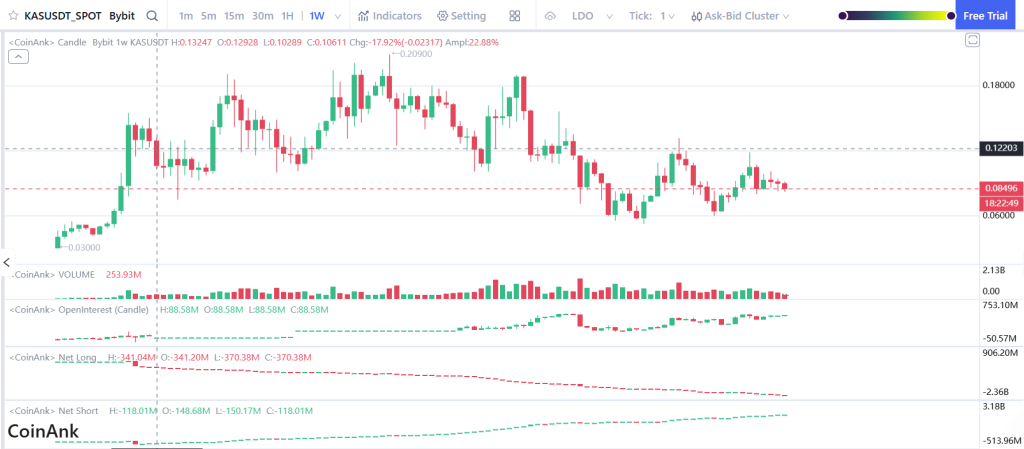
On the weekly chart, you can see how KAS price exploded from around $0.03 all the way to over $0.20. That run was massive, but what followed was a long period of pullbacks and sideways action.
Right now, the price is stuck below $0.09, with resistance lined up around $0.12. Every time bulls have tried to push past it, sellers have stepped in.

On the flip side, there’s a pretty strong support area down around $0.06–$0.07, which has saved KAS price a few times already.
This puts the token in a range. A clean breakout over $0.12 could quickly bring momentum back, but if $0.08 breaks down, we could be looking at a retest closer to the lows.
Read Also: Ripple’s $100B XRP Escrow Fuels Talk of Possible U.S. Government Takeover
Market Indicators
Volume is down to around $253M, much lower than during the wild rallies. That means fewer traders are piling in, but it also leaves room for a big breakout when fresh money flows back in.
Open Interest is steady at about $88M, showing positions are open but nobody’s betting too heavily on one side yet.
Longs vs. Shorts are balanced, though longs have pulled back a bit. That hints at caution in the market.
Volatility is still high at nearly 23%, so even if things look flat, sudden swings up or down are still on the table.
KAS Price Short-Term Outlook for The Week
The key area to watch right now is $0.08–$0.09. If KAS can hold this zone, we could see a push toward $0.10–$0.12, with a breakout above $0.12 opening the door to $0.15.
But if KAS price slips under $0.08, sellers will likely take charge and drag it down toward $0.07–$0.06, where stronger support sits.
For this week, the most realistic scenario is sideways trading with a lot of volatility. It’s a waiting game, either bulls finally take out $0.12, or bears push it back down to test the bottom of the range.
Subscribe to our YouTube channel for daily crypto updates, market insights, and expert analysis.


