Kaspa holders can’t be really happy with how the KAS price is performing today since it’s down 6.5% now trading at $0.075.
It looks like Kaspa faced strong resistance at $0.080 this week and was briefly trading above this level, but then got rejected and pulled back to the current levels.
We predicted yesterday that StochRSI and CCI indicators were suggesting there’s a possibility Kaspa retraced to $0.075-$0.078 range and this is exactly what happened. So, let’s see what technicals are telling us today and where could Kaspa price be headed next.
What you'll learn 👉
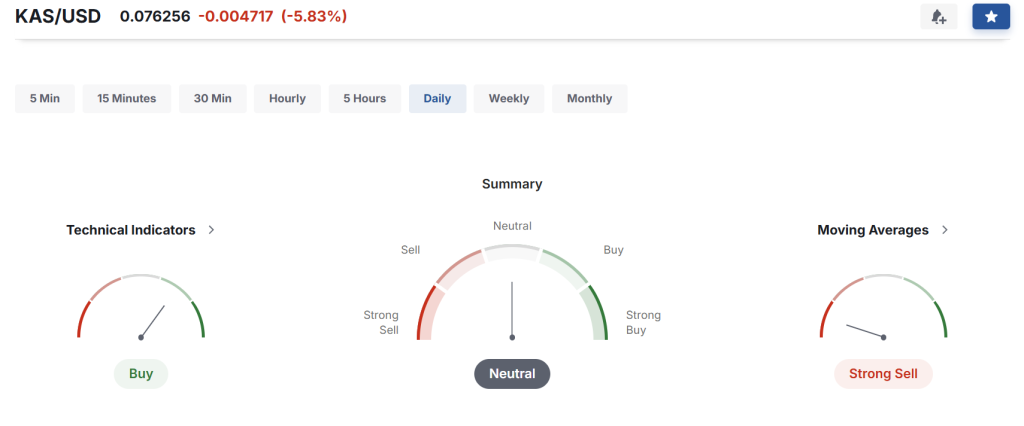
Kaspa Chart: Technical Indicators Analysis
RSI(14) is 46.491 – The Relative Strength Index for Kaspa is currently just below the midpoint of 50. This suggests that KAS is not yet in oversold territory but is leaning slightly toward the bearish side. The asset isn’t showing extreme selling pressure but does lack strong upward momentum at the moment.
STOCHRSI(14) is 80.636 – The Stochastic RSI is showing a high reading above 80, indicating that Kaspa might be approaching overbought conditions within its current RSI range. This could signal a potential short-term pullback or consolidation before further moves upward.
MACD(12,26) is -0.003 – The MACD is slightly below the zero line, showing minimal bearish momentum. The very small negative value suggests the short-term and long-term trends are nearly equal, indicating a possible period of consolidation or indecision in the market.
CCI(14) is 58.2927 – The Commodity Channel Index is moderately positive but not in extreme territory. This indicates some buying pressure exists but isn’t overwhelmingly strong. KAS is showing modest positive momentum according to this indicator.
Ultimate Oscillator is 49.418 – The Ultimate Oscillator reading is just below the 50 midpoint, suggesting a nearly neutral market condition with a slight bearish bias. This multi-timeframe indicator shows balanced buying and selling pressure overall.
ROC is 8.865 – The Rate of Change is positive, showing that Kaspa has gained value compared to its price 14 periods ago. This indicates some underlying positive momentum despite the recent daily pullback.
Read also: Why Kaspa Miner Capitulation May Signal a Bottom for KAS Price
Kaspa Price Forecast for Today
Based on the current technical indicators, the Kaspa price appears to be in a consolidation phase after its recent rejection at the $0.080 level. The slightly bearish RSI and MACD suggest limited downside risk, while the positive CCI and ROC indicate some underlying strength remains.
For today, Kaspa is likely to trade within the $0.072 to $0.078 range. The most probable scenario is continued consolidation near current levels around $0.075 as the market digests recent movements.
In a bullish scenario, if buyers step in and push KAS above the $0.078 resistance, we could see a retest of the $0.080 level. For this to happen though, trading volume would need to increase heavily.
In a bearish scenario, if selling pressure increases, Kaspa might test support at $0.072 or potentially drop toward $0.070. The current technical setup suggests this is less likely unless broader market conditions deteriorate.
Overall, traders should watch for a potential period of stabilization before Kaspa makes its next big move in either direction.
Subscribe to our YouTube channel for daily crypto updates, market insights, and expert analysis.

We recommend eToro
Wide range of assets: cryptocurrencies alongside other investment products such as stocks and ETFs.
Copy trading: allows users to copy the trades of leading traders, for free.
User-friendly: eToro’s web-based platform and mobile app are user-friendly and easy to navigate.