Kaspa price is holding steady just above short-term support after bouncing off recent lows, it is currently trading at $0.07409 after being up 0.05% in the past day.
It managed to climb back above its 9-day moving average earlier this week, which is a positive sign, but the momentum hasn’t really followed through.
The price action looks cautious, and most indicators suggest the market is still figuring out its next move.
After dipping as low as $0.062 on June 22, KAS price saw a strong bounce, but over the last few days, the candles have been small and uncertain, with sellers stepping in at higher levels.
Let’s break down what’s happening today.
What you'll learn 👉
📅 What We Got Right Yesterday
In yesterday’s prediction, we talked about how $0.073 was an important level to watch. If it broke, we expected a potential drop toward $0.067 or even $0.060.
So far, $0.073 has held up, but the price hasn’t made any major moves. KAS price is still trading between $0.072 and $0.075, exactly the kind of sideways action we expected.
Bulls haven’t pushed through resistance, and bears haven’t taken control either. We also mentioned that a strong close above $0.080 could open up a run toward $0.090. That hasn’t happened yet.
📊 Kaspa Daily Overview (June 28)
- Current Price: $0.0738
- Change (24h): +0.42%
- 9-Day SMA: $0.0711
- Volume: Flat and unconvincing
KAS price is still sitting above the 9-day moving average, which is a short-term win for the bulls. But the candles show hesitation.
Traders aren’t pushing in either direction, and volume is lacking. Key resistance sits near $0.078–$0.080, while support remains around $0.071.
🔍 What the KAS Chart Is Telling Us
The Kaspa chart is showing the price is still stuck in the broader downtrend that’s been in place since May.
The big green candle from June 24 looked promising, but the two sessions that followed didn’t build on it.
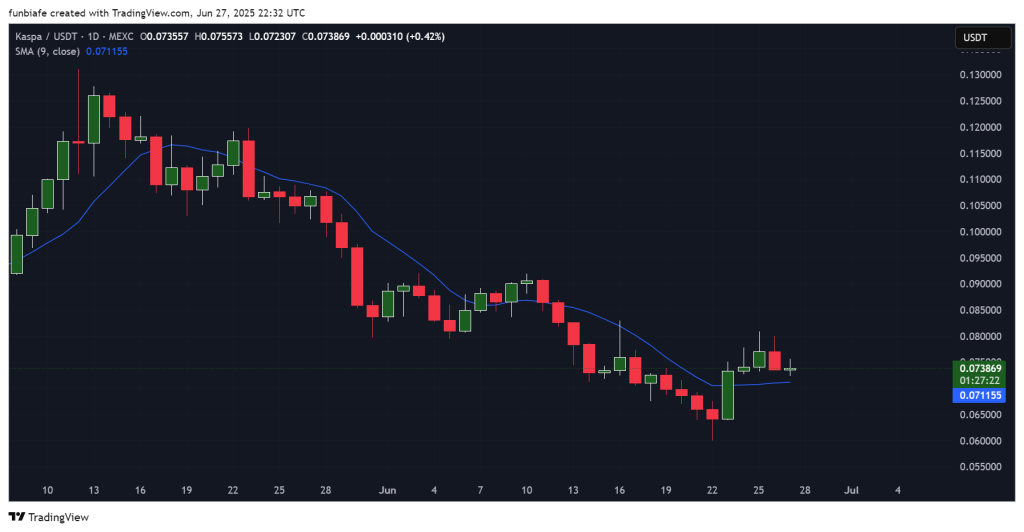
Now, KAS price is just drifting above the moving average, while it waits for a clear signal. Unless we see a clean breakout above $0.078, this sideways pattern will likely continue.
📈 Technical Indicators (Daily Timeframe)
| Indicator | Value | What It Means |
| MACD (12,26) | -0.001 | Bearish, but very weak |
| ADX (14) | 21.835 | A trend might be forming |
| CCI (14) | 1.764 | No strong momentum |
| Ultimate Oscillator | 46.63 | Bears still have some control |
| ROC | 0.018 | Slight bullish momentum |
| Bull/Bear Power (13) | 0.0001 | Bulls have a tiny advantage |
Summary: The overall indicator mix remains neutral with a slight bullish bias, but nothing is confirmed yet. This is typical of a market stuck in limbo.
🔮 What Could Happen Next
Bullish Scenario:
If KAS breaks and closes above $0.078, it could climb toward $0.085 or even $0.090. That hasn’t happened yet.
Neutral Scenario:
If KAS price stays between $0.071 and $0.075, expect more sideways movement until something shifts.
Bearish Scenario:
If Pi price drops below $0.071 and then $0.067, we could be heading back to the $0.060 zone.
Read Also: Why Kaspa Might Be Crypto’s Best Kept Secret
🧠 Final Thoughts
Kaspa price is holding its ground above the 9-day SMA, which is a decent sign, but without stronger buying, it’s just drifting.
For now, the most likely outcome is continued sideways chop between $0.071 and $0.075. A clean move outside that range will set the tone for what’s next.
Subscribe to our YouTube channel for daily crypto updates, market insights, and expert analysis.