Kaspa is currently trading at $0.07112 and it remains under pressure following a string of lower highs and lower lows that began in late May.
With no clear catalyst and continued rejection from trendline resistance, momentum favors the downside. Technical indicators are deeply in sell territory, and short-term support is now being tested again.
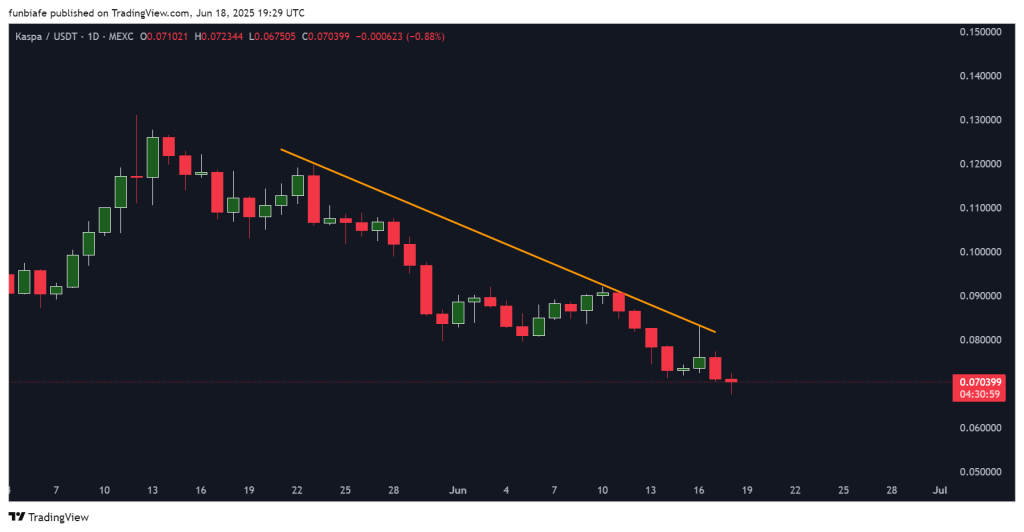
After failing to break above the $0.080 level on June 16, KAS price has drifted lower and is now hovering just above the $0.070 zone.
Let’s take a closer look at today’s setup.
What you'll learn 👉
📅 What We Got Right Yesterday
In yesterday’s prediction, we indicated the $0.070 support as a key level to watch. We also noted that if it failed, KAS price could retest the $0.060–$0.055 range.
That scenario is playing out. Kaspa has remained under the descending resistance line and continues to struggle near $0.070. No breakout above $0.080 has occurred, which keeps the downtrend intact.
We also suggested a possible sideways range between $0.070 and $0.090 if $0.070 held. So far, the price remains at the lower end of that range, showing little strength or follow-through from buyers.
📊 Kaspa Daily Overview (June 19)
- Current Price: $0.0704
- 24h Change: -0.88%
- RSI (14): 40.21
- Volume: Weak and inconsistent
Kaspa price continues to trade below its descending trendline, which began forming in late May. Recent price action shows narrow candles and long wicks, a sign of indecision. The $0.068–$0.070 zone is acting as temporary support, but multiple retests raise concern.
Sellers have consistently defended the trendline, and buyers have failed to build momentum. Without a breakout above $0.077, the structure remains bearish.
🔍 What the Kaspa Chart Is Showing
The Kaspa chart reflects a classic downtrend with repeated rejections at the falling resistance line. After the failed push on June 16, the price dropped back to support, where it now trades with low volatility.
Volume remains weak, and price candles are small-bodied, showing no strong directional interest. Unless KAS can reclaim higher ground with volume, the trend will likely continue lower.
If $0.068 doesn’t hold, the next spot where KAS might bounce is down around $0.060 to $0.062. Bulls have to hold that zone if they want to stop the price from sliding even further.
Read Also: Kaspa Top Wallets Keep Buying KAS Despite Crash: Here’s What They Know
📈 Technical Indicators (Daily Timeframe)
| Indicator | Value | Signal/Interpretation |
| MACD (12,26) | -0.007 | Bearish crossover, negative momentum |
| ADX (14) | 40.673 | Strong trend strength, supports current downtrend |
| CCI (14) | -142.9071 | Deep oversold, but still bearish |
| Ultimate Oscillator | 36.755 | Weak momentum across timeframes |
| ROC | -15.459 | Sharp recent decline |
| Bull/Bear Power (13) | -0.0181 | Bears remain in control |
Summary: All the key indicators are still pointing down. And while the CCI says KAS is oversold, there’s still no real sign of a bounce coming.. ADX confirms the strength of the trend, and sellers remain dominant.
🔮 Kaspa Price Prediction Scenarios
Bullish Scenario:
A break above $0.077–$0.080 with volume could set up a push toward $0.090. No signals support this outcome yet.
Neutral Scenario:
If $0.070 holds up, KAS price could just keep moving sideways between $0.070 and $0.075 while traders wait for a clearer direction.
Bearish Scenario:
If KAS ends up closing below $0.068, we could see it drop again maybe to $0.060, or even $0.055 if selling pressure keeps up.
🧠 Wrapping Up
Kaspa price is still stuck below key resistance, and none of the momentum indicators are hinting at a reversal yet. The price keeps drifting lower, and with volume weak like this, it doesn’t look like buyers are jumping in anytime soon.
Right now, everyone’s watching the $0.068 support zone. If that breaks, Kaspa could slide back to prices we saw in early May. Unless the downtrend gets broken or some volume kicks in, sellers are still running the show.
Subscribe to our YouTube channel for daily crypto updates, market insights, and expert analysis.