Kaspa remains under heavy pressure as it trades near the lower edge of a well-defined consolidation range and is currently trading at $0.07177.
After a steep drop from mid-May highs, the price is struggling to stay above key support, with momentum indicators showing no sign of reversal, the token is down 10.50% in the past day.
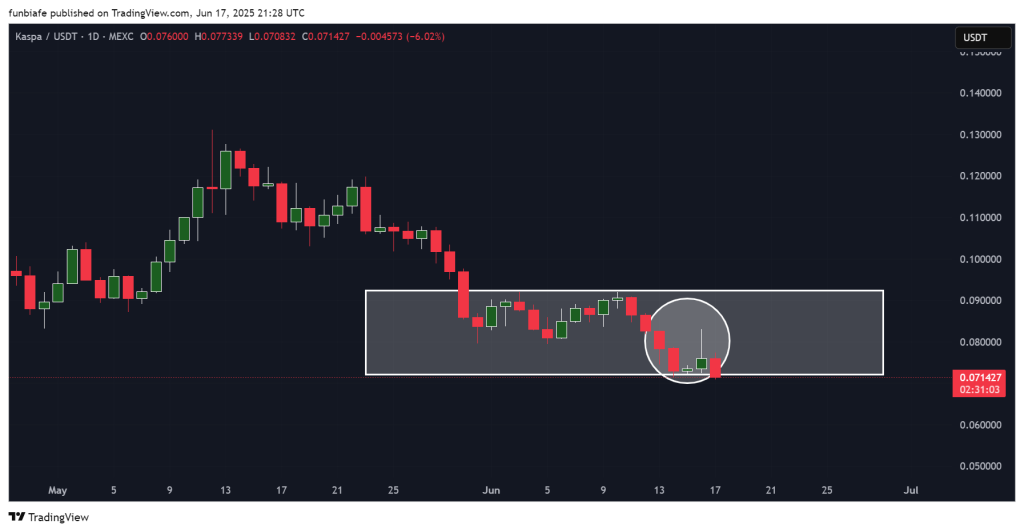
The token has now spent over two weeks bouncing between $0.070 and $0.090, failing to gain traction. As of today, KAS price sits just above $0.071, with bearish signals still dominating the daily chart.
Let’s break down today’s market setup.
What you'll learn 👉
📅 What We Got Right Yesterday
In yesterday’s analysis, we flagged the $0.070–$0.072 zone as critical support and suggested that if buyers didn’t step in, the price could revisit this level or fall further.
That scenario played out, as Kaspa rejected $0.083 resistance and moved sharply lower toward the bottom of the range. The price action is now hovering right at that key level, with no bullish follow-through.
We also noted that unless KAS price could break above $0.083 and hold, more sideways action or further decline was likely. That remains the case today, with the token continuing to stall under short-term resistance.
📊 Kaspa Daily Overview (June 18)
- Current Price: $0.0714
- 24h Change: -6.02%
- Volume: Moderate, no breakout signals
Kaspa price is trapped in a consolidation range between $0.070 and $0.090. The lower boundary continues to attract buyers, but sellers are in control. The price action remains weak, with small-bodied candles and low conviction.
🔍 What the Kaspa Chart Is Showing
The Kaspa chart displays a bearish structure with no change in trend. The failure to reclaim $0.083 has left the token vulnerable. Small candles near support suggest indecision, but with dominant selling volume.
The lower end of the range ($0.070) has acted as a temporary floor, though repeated tests increase the chance of a breakdown.
If support fails, the next downside area lies around $0.060–$0.055, where previous consolidation occurred earlier this year. Bulls need a daily close above $0.090 to shift structure, but there’s no sign of that yet.
Read Also: Kaspa Price Bounces Off Lows, But Holder Behavior Signals Caution
📈 Technical Indicators (Daily Timeframe)
| Indicator | Value | Signal / Interpretation |
| MACD (12,26) | -0.001 | Bearish momentum, below signal line |
| ADX (14) | 68.234 | Very strong trend strength, confirms downtrend |
| CCI (14) | -132.57 | Deep in bearish territory, near oversold |
| Ultimate Oscillator | 44.23 | Bearish tone, below neutral |
| ROC (Rate of Change) | -4.5 | Negative momentum persists |
| Bull/Bear Power (13) | -0.0026 | Bear pressure still dominant |
Summary: All indicators continue to flash sell. The ADX shows the downtrend is still going strong, and other indicators like MACD, ROC, and CCI all back that up. There’s still no hint of a bullish reversal or any divergence on the daily chart.
🔮 Kaspa Price Prediction Scenarios
Bullish Scenario:
A breakout above $0.090 with high volume would signal the start of a trend reversal. Until then, the bias remains down.
Neutral Scenario:
If $0.070 manages to hold once more, Kaspa price could just keep bouncing between $0.070 and $0.090 while traders wait for a reason to move.
Bearish Scenario:
If Kaspa ends the day below $0.070, that would pretty much confirm a breakdown and the price could drop to around $0.060 or even $0.055.
🧠 Wrapping Up
Kaspa price is still hanging near its support level, but there’s no real momentum or catalyst to push it higher. Right now, the setup looks more like it’ll keep ranging or possibly break lower.
Unless buyers can push Kaspa back above $0.083 with some real strength, the short-term outlook stays pretty weak. For now, the price will likely keep chopping between $0.070 and $0.075 unless something big breaks that range.
Subscribe to our YouTube channel for daily crypto updates, market insights, and expert analysis.