Kaspa just had a strong bounce from its recent lows, its price jumped more than 9% in the past day. It’s now trading just below a key resistance level around $0.082, and traders are watching closely to see if this move has any real strength behind it.
While the daily candle looks bullish, the bigger trend is still pointing down, and momentum indicators aren’t exactly showing confidence yet.
So, the big question is: is this the start of a recovery, or just another temporary bounce in a downtrend?
What you'll learn 👉
📊 Kaspa Daily Overview (June 17)
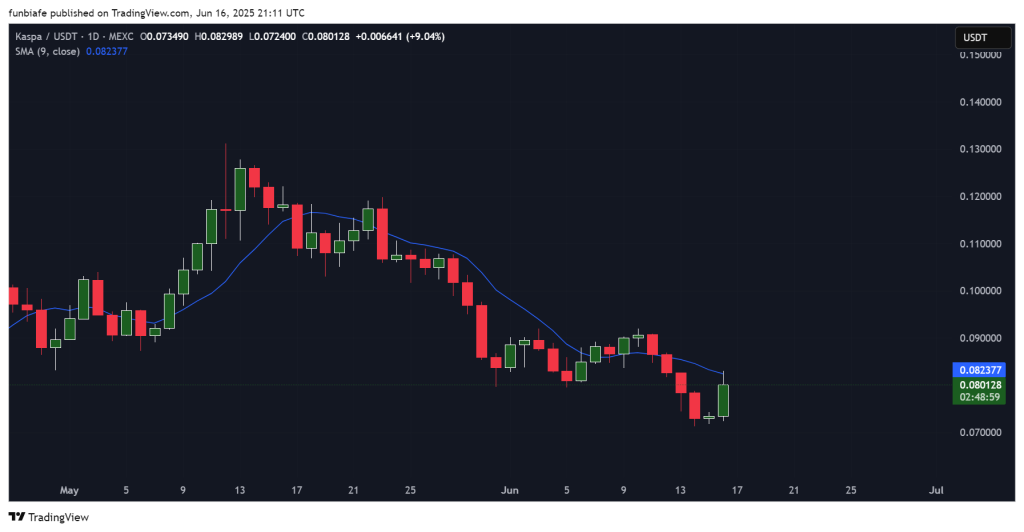
Kaspa price is currently sitting around $0.0801, just under the 9-day Simple Moving Average, which has been a tough level to break since late May.
The latest daily candle is a bullish engulfing pattern usually a good sign for buyers but we’ve seen similar setups get rejected in the past.
So far, this bounce hasn’t been backed by a noticeable surge in volume, which means buyers still need to prove they’re serious.
If KAS price can break above $0.083 and hold it, that might open the door for more upside. But if the price stalls again, we could see it drop back toward the $0.072–$0.074 support area, or even lower.
🔍 What the Kaspa Chart Is Telling Us
Looking at the chart, Kaspa price has been in a clear downtrend since its late May peak near $0.13. It’s been making lower highs and lower lows, which is typical bearish structure.
Every bounce has been met with selling, and buyers haven’t been able to take back control. This latest green candle is the strongest in weeks, but one candle isn’t enough to call a reversal.
If bulls can push through $0.083 and follow it up with more volume, we could see a short-term rally toward $0.090 or even $0.093. If not, there’s still a good chance this bounce fades.
Read Also: Kaspa Price Bounces Off Lows, But Holder Behavior Signals Caution
📈 Technical Indicators (Daily Timeframe)
| Indicator | Value | Interpretation |
| MACD | -0.006 | Still showing weak bearish momentum |
| ADX | 31.877 | Trend is active, but direction unclear |
| CCI | -88.7541 | Close to oversold, still leaning bearish |
| Ultimate Oscillator | 45.997 | Weak momentum, no clear signal |
| ROC | -10.547 | Sellers still have the edge |
| Bull/Bear Power | -0.0106 | Bears are still in control |
Even with the bounce, most indicators aren’t showing much improvement yet. MACD is still bearish, and the momentum tools are still pointing south. The CCI is nearly oversold, which might attract short-term buyers, but there’s no real confirmation of a reversal so far.
🔮 Kaspa Price Prediction Scenarios for June 17
If Kaspa breaks above the 9-day SMA and closes over $0.083, the price could head toward $0.090–$0.093. That would be a clear signal that buyers are starting to gain control again.
But if Kaspa price can’t break that resistance, we could see sideways action or another drop toward $0.072 or even $0.068. Right now, the overall setup still leans bearish, and traders will be looking for more signs before calling this a true reversal.
Subscribe to our YouTube channel for daily crypto updates, market insights, and expert analysis.

We recommend eToro
Wide range of assets: cryptocurrencies alongside other investment products such as stocks and ETFs.
Copy trading: allows users to copy the trades of leading traders, for free.
User-friendly: eToro’s web-based platform and mobile app are user-friendly and easy to navigate.