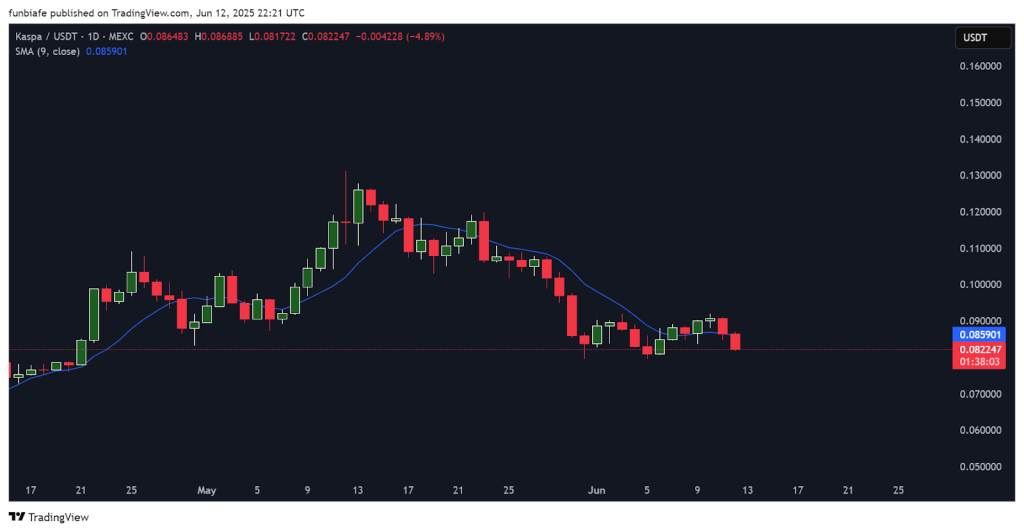
Kaspa price continues to face selling pressure as the broader market remains indecisive. The token is now down at around 4.34% below a resistance zone at $0.08 and showing no clear signs of recovery.
After a failed bounce attempt, the price has moved back toward its recent lows, whuch prompts questions about whether more downside is ahead.
What you'll learn 👉
📊 Kaspa Daily Overview (June 13)
Kaspa is currently trading near $0.082, below the short-term resistance defined by the 9-day Simple Moving Average. The price action remains bearish, with the latest daily candle confirming a nearly 5% drop.
This decline has pushed KAS price further away from the moving average, which has acted as resistance since late May. Over the past 24 hours, volume has stayed muted, and buyers have shown limited conviction.
The broader structure remains weak, and all recent bounce attempts have been short-lived. On the day chart, candles are showing smaller bodies with no strong reversal signals, suggesting that the current move may extend lower.
🔍 What the Kaspa Chart Is Showing
The KAS chart clearly shows a persistent downtrend. Since peaking in mid-May, price has been forming consistent lower highs and lower lows. Each bullish candle has been followed by strong red candles, confirming that sellers are still in control.
Currently, Kaspa price is testing a short-term support zone at $0.082 and $0.085, that was last visited between June 4 and 6. If that support fails, the next area to watch lies near the early April breakout zone.
There are no bullish reversal patterns, no long lower wicks, and no sign of absorption, all suggesting that downside risk is still present.

Resistance remains defined by the 9-day SMA, and unless KAS closes above it with volume, bulls are unlikely to regain control.
📈 Technical Indicators (Daily Timeframe)
| Indicator | Value | Interpretation |
| MACD | -0.001 | Weak bearish momentum remains |
| ADX | 34.455 | Strong downtrend in progress |
| CCI | -179.53 | Deeply oversold, heavy selling pressure |
| Ultimate Oscillator | 39.40 | Bearish zone, no reversal signals |
| ROC | -4.228 | Momentum continues to favor sellers |
| Bull/Bear Power | -0.003 | Bears still have control |
The indicators are aligned with the bearish chart structure. MACD remains negative, and the ADX confirms a strong trend. ROC shows consistent loss in momentum, and Bear Power remains negative.
The CCI is in deep oversold territory, which might attract short-term traders, but there is no confirmation of a bounce yet.
🔮 Kaspa Price Prediction Scenarios for June 13
If Kaspa fails to hold above current support levels, the price could slip further toward the early April zone. This would indicate that sellers are still in charge and could lead to another leg down.
If KAS holds this support but remains below the 9-day SMA, expect more sideways movement between current levels and the short-term resistance. That would signal market indecision with no clear trend shift.
If bulls manage to push KAS price above the 9-day SMA with solid volume, that could open a path toward a short-term rebound.
But for now, the overall setup remains tilted toward the downside, and traders are watching for any signs of reversal or acceleration lower.
Read Also: How Much Will 13,500 Kaspa (KAS) Tokens Be Worth by 2026?
Subscribe to our YouTube channel for daily crypto updates, market insights, and expert analysis.
We recommend eToro
Wide range of assets: cryptocurrencies alongside other investment products such as stocks and ETFs.
Copy trading: allows users to copy the trades of leading traders, for free.
User-friendly: eToro’s web-based platform and mobile app are user-friendly and easy to navigate.


