

Kaspa price is still stuck in a tight range after its bounce in late June. It had a decent rally, but so far, it hasn’t been able to push through resistance.
The charts are starting to lean bearish again, and miner selling isn’t helping. Reports suggest that miners are offloading KAS in favor of BTC and TAO, which is adding more selling pressure.
Right now, KAS price is trading around $0.075, sitting right in the middle of its consolidation zone. Volume has picked up a bit, but the price is still struggling to break above that key $0.0775 level.
Let’s take a closer look at today’s setup.
What you'll learn 👉
📊 Kaspa Daily Overview (July 8)
- Current Price: $0.07519
- 24h Change: -2.97%
- 4H RSI (14): 41.36
- Volume: Up 23% from the previous day
Kaspa price has been trading between $0.0735 and $0.0775 for several sessions, showing no clear breakout or breakdown. The recent drop follows reports that miners are swapping KAS for BTC and TAO, adding downward pressure. Despite this, rising volume suggests market participants are active and awaiting direction.
🔍 What the Kaspa Chart Is Showing
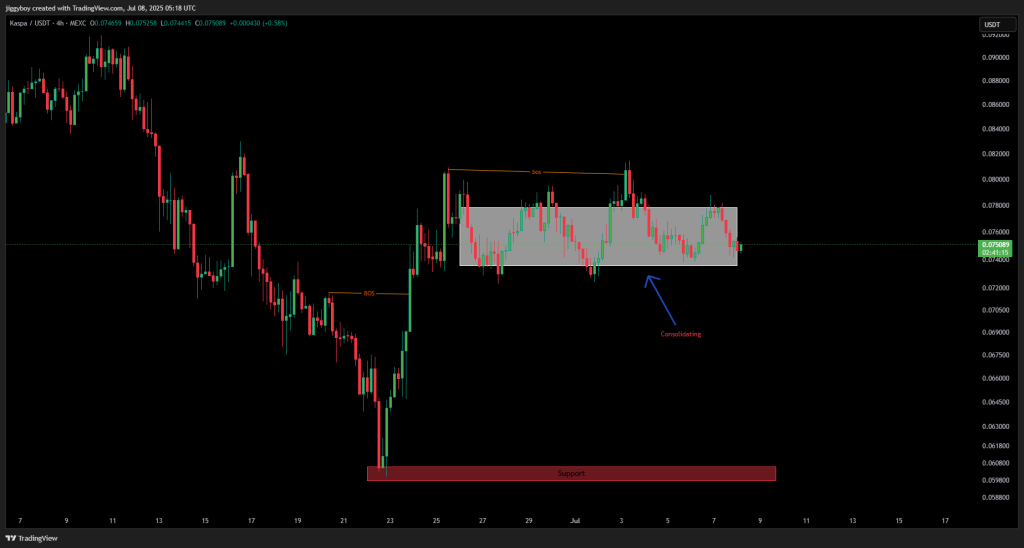
The 4H chart displays a strong rebound from the $0.060 support zone in late June, followed by two confirmed breaks of structure (BOS), one around June 23 and another shortly after. These marked the end of the prior downtrend.
Since then, the price has been stuck in a tight consolidation box. The $0.0775 level has acted as resistance, while $0.0735 has provided soft support. Price action remains undecided, with no strong directional moves.
If buyers can push through $0.0775 on volume, a move toward $0.082 may follow. A breakdown below $0.0735, however, could lead to a retest of the $0.060 demand zone.
Read Also: 4 Top AI Tools Predict the XRP Price in 2025
📈 Technical Indicators (Hourly Timeframe)
| Indicator | Value | Signal / Interpretation |
| RSI (14) | 41.36 | Weak momentum, leaning bearish |
| ADX (14) | 54.71 | Strong trend, likely downward |
| MACD (12,26) | 0.00 | Bearish crossover, signals uncertainty |
| CCI (14) | -43.73 | Mild bearish tone, still within neutral range |
| ROC (Rate of Change) | -1.326 | Negative momentum, selling bias |
| Bull/Bear Power (13) | -0.0001 | Slight bearish dominance |
Summary: Indications are in the direction of bearish control on the short-term chart. RSI and ROC indicate weakening strength, while ADX suggests that a strong trend has formed. The MACD is zero, indicating no bullish sentiment.
🔮 Kaspa Price Prediction Scenarios
Bullish Scenario:
If Kaspa can break above $0.0775 on strong volume, buyers may target $0.082–$0.085 in the short term.
Neutral Scenario:
Sideways movement between $0.0735 and $0.0775 is likely for KAS price if no new catalyst appears. Volume remains key.
Bearish Scenario:
A close below $0.0735 will likely expose downside toward previous support around $0.060–$0.062, where demand last operated.
🧠 Wrapping Up
Kaspa price action remains range-bound as the market digests miner sell pressure and overall altcoin weakness. Although volume is rising, the token is still in consolidation, waiting for a breakout. For the time being, traders will be monitoring closely around the $0.0735 and $0.0775 levels to determine what to do next.
Subscribe to our YouTube channel for daily crypto updates, market insights, and expert analysis.


