Kaspa price rally looks like it’s running out of steam. Following a strong push earlier in the month, price is now retracing and is sitting just below the $0.10 mark.
The buying momentum which pushed it up towards $0.12 has paused, and traders are awaiting the next move.
Let’s look at what is going on with the charts and what might happen moving forward.
What you'll learn 👉
📅 What We Got right Yesterday
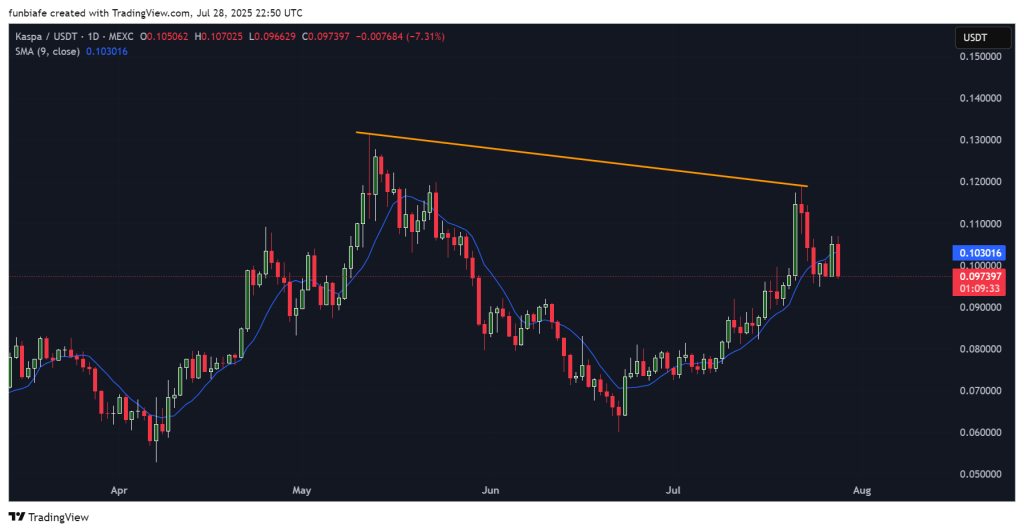
In yesterday’s prediction, we pointed out that Kaspa price needed to break above $0.117 to keep the rally alive. It got close but couldn’t push through. Instead, it hit that descending trendline resistance and dropped hard, right back under $0.10.
We also mentioned the 9-day SMA at $0.103 as a short-term line to watch. KAS lost that level too, confirming the rejection. The price is now hovering between $0.093 and $0.103, which is the same range we flagged as likely in a neutral scenario.
📊 Kaspa Snapshot (July 29)
- Current Price: $0.0974
- 24h Change: -7.31
- 9-Day SMA: $0.1030
After getting rejected near $0.12, Kaspa price is now pulling back. It lost the 9-day moving average and is finding support around the $0.093–$0.095 area. That’s where buyers stepped in during the last pullback, so it’s an area to watch.
🔍 What the Kaspa Chart Shows
There’s still that descending trendline from April to July acting like a lid on every rally. Kaspa hit it again and got pushed back. As long as it stays below that line, bulls will have a tough time breaking through.
The 9-day moving average flipped from support to resistance, and volume is dropping. That usually means buyers are stepping back and waiting. If KAS price can bounce from the $0.093 zone, there might be another attempt higher. But for now, momentum looks shaky.
📈 Key Indicators (Daily Timeframe)
| Indicator | Value | What It Means |
| RSI (14) | 53.6 | Neutral – no strong trend either way |
| ADX (14) | 44.1 | Strong trend in place – still bullish |
| MACD (12,26) | 0.005 | Momentum is still pointing up |
| CCI (14) | 27.9 | Neutral zone – nothing extreme |
| Ultimate Oscillator | 0.0077 | Bearish signal – low momentum |
| Bull/Bear Power (13) | 0.0013 | Slight edge for buyers |
Summary: The signals are a bit mixed. The trend is still strong, but short-term momentum is cooling off. It’s a tug of war between bulls and bears right now.
🔮 What Could Happen Next
Bullish Scenario:
If KAS can get back above $0.103 and break that $0.117 level, we could see another push toward $0.125. But it needs volume to support the move.
Read Also: Kaspa Open Interest Rises as Traders Position for Next Move
Neutral Scenario:
If Kaspa price holds between $0.093 and $0.103, we’ll probably see some sideways chop until something changes.
Bearish Scenario:
A break below $0.093 might drag the price toward $0.085 or even back to the July base around $0.067.
🧠 Bottom Line
Kaspa price is at a tricky spot. It had a solid run, but the rejection at $0.12 has shifted momentum. Keep an eye on that $0.093 zone. That’s the key short-term level to watch today.
As of now, the most likely outcome is more sideways action between $0.093 and $0.103. Unless bulls step in with volume and flip resistance into support.
Subscribe to our YouTube channel for daily crypto updates, market insights, and expert analysis.