Kaspa price is under pressure again after getting rejected near long-term resistance. The price hit the $0.115–$0.117 zone earlier this week but couldn’t push through.
It’s now dropped back to $0.09945, just below the 9-day moving average, and traders are watching closely to see what happens next.
After a solid run-up from late June, the rally seems to be losing steam. The trendline that’s been in place since late 2023 is still holding firm, and KAS price is now testing short-term support.
What you'll learn 👉
📅 What We Got Right Yesterday
In yesterday’s prediction, we pointed out that if Kaspa couldn’t break above $0.120, a pullback toward $0.099–$0.093 was on the table. That’s exactly how things played out.
KAS price got rejected at resistance, and the price has since dropped over 4%, slipping under the $0.100 mark. We also mentioned that losing the 9-day SMA would put pressure on the short-term trend, and now that level is in play.
📊 Kaspa Daily Snapshot (July 25)
- Current Price: $0.09945
- 24-Hour Change: -4.62%
- Volume: Cooling after recent surge
Kaspa price is sitting at a crossroads. If it can bounce from here, the short-term uptrend may stay intact. If not, it could retest deeper levels.
🔍 What the Kaspa Chart Is Telling Us
The big picture still shows a downward trend, with Kaspa repeatedly failing to break above that same falling trendline.
The rally over the past month gave bulls some hope, but unless KAS price can break above $0.117, the larger structure hasn’t changed.
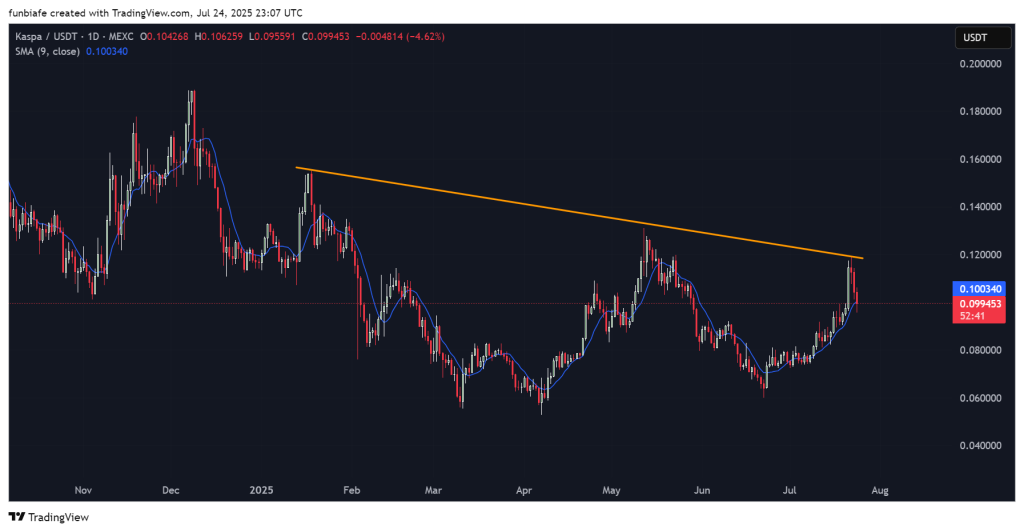
If the current support collapses, look for possible pullbacks to $0.093, $0.090, or even $0.080, where the past significant higher low is.
📈 Technical Indicators (Daily Timeframe)
| Indicator | Value | What It Means |
| RSI (14) | 60.15 | Bullish momentum, not overbought |
| ADX (14) | 60.58 | Very strong trend |
| MACD (12,26) | 0.007 | Still bullish, but flattening out |
| CCI (14) | 65.93 | Positive, but slowing |
| Ultimate Oscillator | 54.79 | Still in bullish territory |
| Bull/Bear Power (13) | 0.0078 | Bulls holding on, barely |
Summary: The indicators are still showing strength, but that momentum could fade if KAS doesn’t hold current support.
🔮 What Could Happen Next
Bullish Scenario:
If KAS breaks out above $0.120, it can go up to $0.135 or $0.140.
Read Also: Kaspa (KAS) Price Drops, But ‘Diamond Hands’ Are Growing – Here’s What That Means
Neutral Scenario:
Kaspa price floats between $0.099 and $0.105, trading flat until a clearer signal is made
Bearish Scenario:
A breakdown below $0.099 could send KAS down to $0.090 or $0.085.
🧠 Final Thoughts
Kaspa is in a tight spot right now. Bulls need to hold the line at $0.099–$0.100 or risk losing momentum.
Unless KAS price breaks out or breaks down, today’s move may just be more sideways action. Keep an eye on volume and that trendline, whichever gives first will likely set the tone for what’s next.
Subscribe to our YouTube channel for daily crypto updates, market insights, and expert analysis.