

The Kaspa price has just broken above a key resistance zone after steadily climbing for weeks. The breakout on the 4-hour chart looks strong, backed by solid momentum and support from that rising trendline it’s been respecting.
Now that the price is sitting above $0.101, things still look bullish in the short term. But some indicators are flashing early signs that the rally might be a bit stretched. So, a pullback or a brief sideways move wouldn’t be surprising here.
Let’s take a closer look at today’s setup for Kaspa.
What you'll learn 👉
📊 Kaspa Daily Overview (July 21)
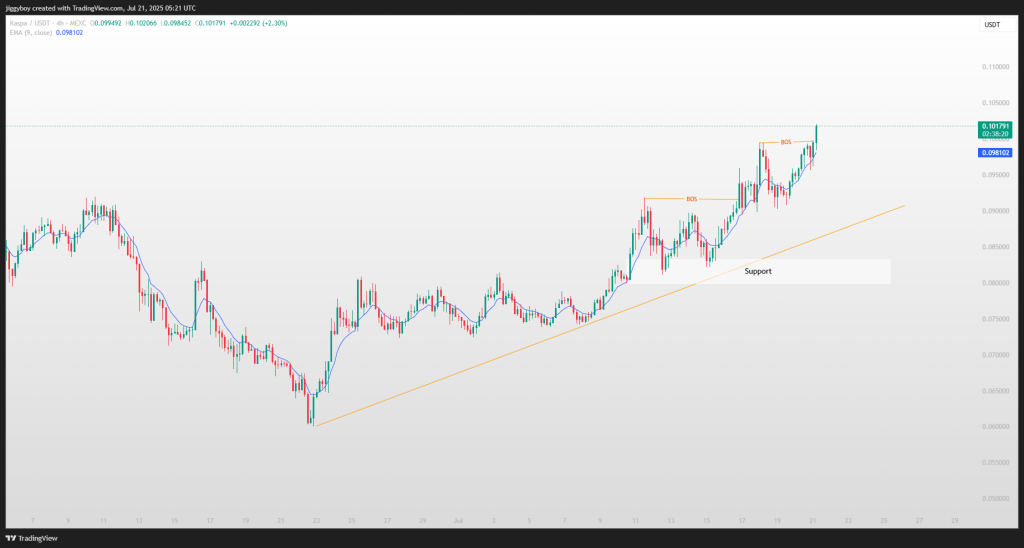
- Current Price: $0.10179
- 24h Change: +8.10%
- EMA (9): $0.09810
- RSI (14): 67.91
- Volume: Increasing
Kaspa price continues to trade above the 9-period EMA, confirming the strength of the uptrend. The latest breakout through the $0.101 resistance area is supported by strong structure, higher lows, and multiple break-of-structure (BOS) confirmations since June. Volume is gradually rising, adding weight to the bullish continuation case.
🔍 What the Kaspa Chart Is Telling Us
The 4H chart reveals a clear bullish setup with higher highs and rising support from both trendlines and horizontal zones. The latest breakout candle has pushed through a critical zone, indicating possible continuation toward the $0.105–$0.11 range.
Three BOS points have formed in recent weeks, the last of which confirms the continuation of bullish momentum. Below the breakout level, strong support is located around $0.098 and deeper at $0.082–$0.085. The trendline from June 23 remains intact.
📈 Technical Indicators (Hourly Timeframe)
| Indicator | Value | Signal / Interpretation |
| MACD (12,26) | 0.001 | Bullish crossover, upside momentum building |
| CCI (14) | 211.78 | Overbought, strong upward pressure but room for pause |
| RSI (14) | 67.91 | Bullish, close to overbought zone |
| ADX (14) | 32.56 | Strong trend strength, buyers in control |
| ROC | 2.563 | Price rising steadily, momentum sustained |
| Bull/Bear Power (13) | 0.0046 | Slight bull advantage, momentum tilted upward |
Summary: Indicators support a bullish bias, although the overbought CCI reading may suggest the need for cooling or a support retest.
🔮 Kaspa Price Prediction Scenarios
Bullish Scenario:
If the breakout above $0.101 is validated with volume, Kaspa could aim for $0.105–$0.11 next. Trend and momentum remain intact.
Neutral Scenario:
A rejection near current levels can witness consolidation between $0.098 and $0.101, where good support exists.
Bearish Scenario:
If KAS price closes below $0.098 and fails to hold the trendline, price could revisit $0.085 or $0.082 support zones.
🧠 Wrapping Up
Kaspa price is holding a bullish structure with rising momentum and trendline support. The $0.105–$0.11 area now acts as the next resistance target. A pullback to $0.098 remains in play but is unlikely to break the overall structure unless selling volume spikes.
Moreover, smart contracts are set to go live on Kaspa with the official launch of Kasplex Layer 2 mainnet on August 31st, a development that could influence both price and market attention in the coming weeks.
Read Also: How High Can XDC Network Price Go in 2025? One Expert’s Answer Might Surprise You
Subscribe to our YouTube channel for daily crypto updates, market insights, and expert analysis.


