Kaspa price is starting to look strong again after bouncing off its $0.060 support zone. Over the past few days, the price has worked its way back to the top of a familiar range
Kaspa is knocking on the door of a key resistance level, $0.096. Whether or not it can break through will likely set the tone for what’s next. The token has been stuck in a wide range between $0.060 and $0.096 since May.
Now, it’s testing both the upper end of that box and a descending trendline that’s been holding it back since the May high. If bulls manage to push through, we could see Kaspa price stretch toward $0.10 or even $0.12.
What you'll learn 👉
📅 What We Got Right Yesterday
In yesterday’s prediction, we mentioned that a close above $0.090 could open the door to $0.098, maybe even $0.11 if momentum stayed strong.
Sure enough, KAS price climbed as high as $0.096 during the session, just shy of breaking out. Support near $0.060 remains solid and continues to act as the foundation for this move.
We also pointed out that if it couldn’t clear resistance, price might drift sideways between $0.080 and $0.090. That range is still very much in play if the breakout doesn’t stick.
📊 Kaspa Daily Overview (July 17)
- Current Price: $0.0923
- 24h Change: +5.58%
- 4H RSI: 65.81
- Volume: Steady with a slight uptick
Kaspa price is pushing into resistance, but we haven’t seen a confirmed breakout yet. Price needs to close above the $0.096–$0.10 zone to truly break free.
🔍 What the Kaspa Chart Telling Us
The daily KAS chart shows a big sideways range from $0.060 to $0.096. After forming a rounded bottom between June and early July, price has climbed steadily toward the top of the box.
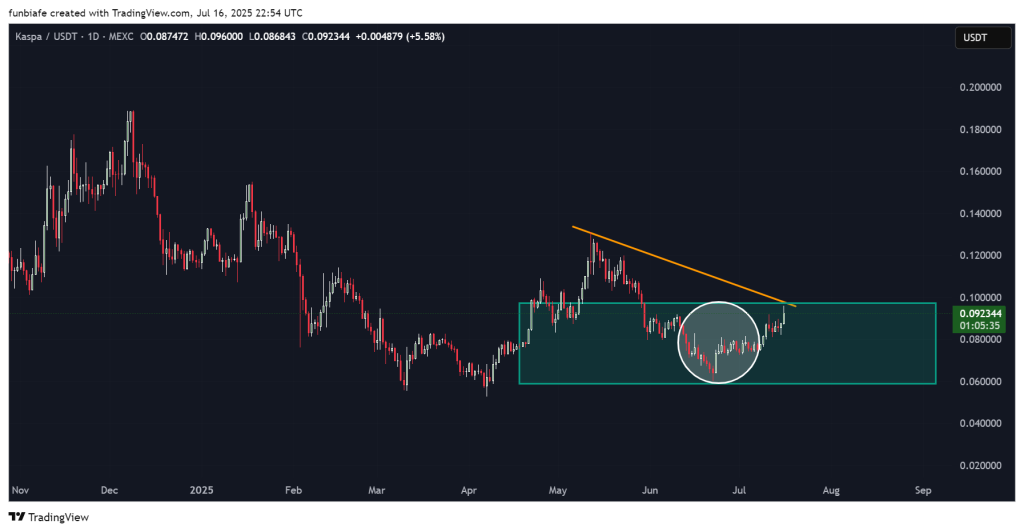
That rounded structure suggests buyers have been quietly accumulating, and now they’re making a move. The next challenge is breaking the orange trendline that’s capped every rally since May. No breakout yet, but pressure is building.
📈 Technical Indicators (Daily Timeframe)
| Indicator | Value | What It Means |
| RSI (14) | 65.81 | Strong momentum, not overheated |
| MACD (12,26) | 0.002 | Bullish crossover in progress |
| CCI (14) | 154.82 | Buyers firmly in control |
| Ultimate Oscillator | 54.90 | Positive across multiple timeframes |
| ROC | 18.91 | Price rising sharply |
| Bull/Bear Power | 0.0148 | Bulls still have the edge |
Summary: Every major indicator is flashing buy. Momentum’s there, and nothing looks overheated yet. Bulls are in charge.
🔮 What to Watch for Today
Bullish Scenario:
If KAS can close above $0.096, it could pop toward $0.10 or even $0.12. That would confirm the breakout.
Neutral Scenario:
If KAS price stalls again below resistance, expect more sideways chop between $0.080 and $0.096 until something stronger develops.
Bearish Scenario:
If price slips back under $0.080, bears could regain control. That might bring $0.075 or even $0.066 back into focus.
🧠 Final Thoughts
Kaspa price is right at the edge of a breakout, but it’s not there yet. Bulls have made a solid push, and the indicators all support more upside, but the daily close will be the deciding factor.
All eyes are on the $0.096 level. A clean break could trigger the next move up, but if it fails again, we may see more sideways action.
Read Also: Here’s Why Kaspa (KAS) Could Benefit Big From the CLARITY Act
Subscribe to our YouTube channel for daily crypto updates, market insights, and expert analysis.