

Kaspa has been making some noise lately,it’s currently trading at $0.08573, and it’s bouncing off its recent lows and pushing higher over the past week.
After testing intraday highs near $0.0919, Kaspa price failed to hold gains and has slipped back below $0.086.
The next few sessions could decide whether this recovery continues or fades back into the broader downtrend.
Let’s break it all down.
What you'll learn 👉
📅 What We Got Right Yesterday
In yesterday’s prediction, we pointed out the $0.088–$0.090 zone as a key resistance area, and today’s chart respected it perfectly.
Kaspa price reached an intraday high of $0.0919 but quickly got rejected and dropped back to around $0.085.
We also mentioned that if bulls couldn’t break that level with volume, a pullback could be on the table. That’s exactly what’s starting to happen now, sellers are showing up again just as price reaches that trendline.
📊 Kaspa Daily Overview (July 12)
- Current Price: $0.0853
- 24h Change: -1.73%
- 9-Day SMA: $0.0793 (slightly rising)
- Volume: Holding steady, but not breakout-worthy
Kaspa price is still trading above its 9-day moving average, which is a good sign for short-term momentum. But until it breaks above that descending orange trendline, the bigger picture still leans neutral at best.
🔍 What the Kaspa Chart Is Telling Us
Kaspa has been stuck under this trendline since mid-May. Today marked yet another rejection at that same level, that’s three failed attempts now.
Buyers have stepped up since the $0.070 bottom, but they need to push through this resistance if they want a real trend shift. Otherwise, it’s just another bounce in a bigger downtrend.
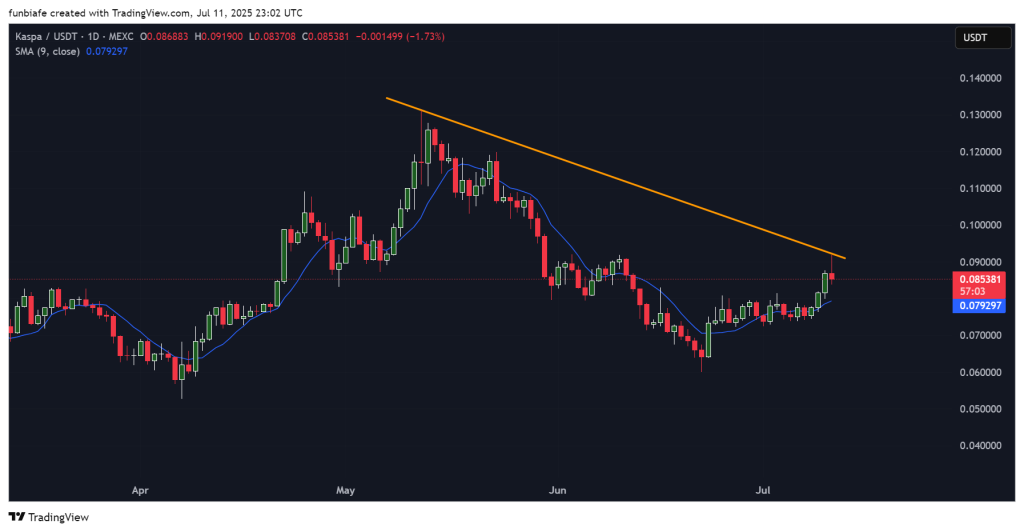
The candles from the past few days looked strong, but today’s wick and red close show hesitation. The fight between buyers and sellers is heating up.
📈 Key Indicators (Daily Timeframe)
| Indicator | Value | What it means |
| RSI (14) | 57.87 | Bullish, but not overheated yet |
| ADX (14) | 34.92 | Decent trend strength backing this move |
| MACD (12,26) | 0.000 | Flat – no clear signal yet |
| CCI (14) | 278.96 | Way overbought – caution zone |
| ROC | 13.79 | Strong short-term momentum |
| Bull/Bear Power | 0.0181 | Slight edge for bulls today |
Summary: The momentum is mostly in the bulls’ favor, but the overbought CCI and flat MACD suggest we might be due for a pause or pullback.
🔮 Where Kaspa Could Go Next
Bullish Scenario:
We could see a move toward $0.10 or even $0.108. But it has to close above that level on volume, otherwise, it’s just another fakeout.
Read Also: Kaspa Holders Show Mixed Behavior, But This New Crypto Presale Draws Millions
Neutral Scenario
KAS price might keep bouncing around between $0.080 and $0.090 until something stronger kicks in, news, volume, or just more conviction.
Bearish Scenario:
Dropping below $0.080 opens the door for a revisit to the $0.072–$0.078 area, where support last held in late June.
🧠 Final Thoughts
Kaspa price has been on a solid run lately, but the key resistance zone is still putting up a fight. The trendline hasn’t broken yet, and buyers are running into some friction.
Short-term momentum looks decent, but without a strong breakout above $0.090, this could turn into a sideways grind, or even a reversal if support doesn’t hold.
For now, all eyes are on that trendline. Break it, and we’re in a different ballgame. Fail again, and we might be heading back down.
Subscribe to our YouTube channel for daily crypto updates, market insights, and expert analysis.


