Kaspa price is trying to bounce after a steep slide from its July peak. Sellers have been in control for weeks, but buyers are starting to show up around short-term support levels.
The token dropped more than 30% from $0.12 and is now hovering near $0.085. A small bounce from $0.082 is giving bulls a bit of hope, but the bigger trend still leans down.
Let’s take a closer look at today’s setup.
What you'll learn 👉
📊 Kaspa Hourly Overview (August 3)
Current Price: $0.08528
24h Change: -0.45%
1H RSI (14): 55.402
Volume: -19.62
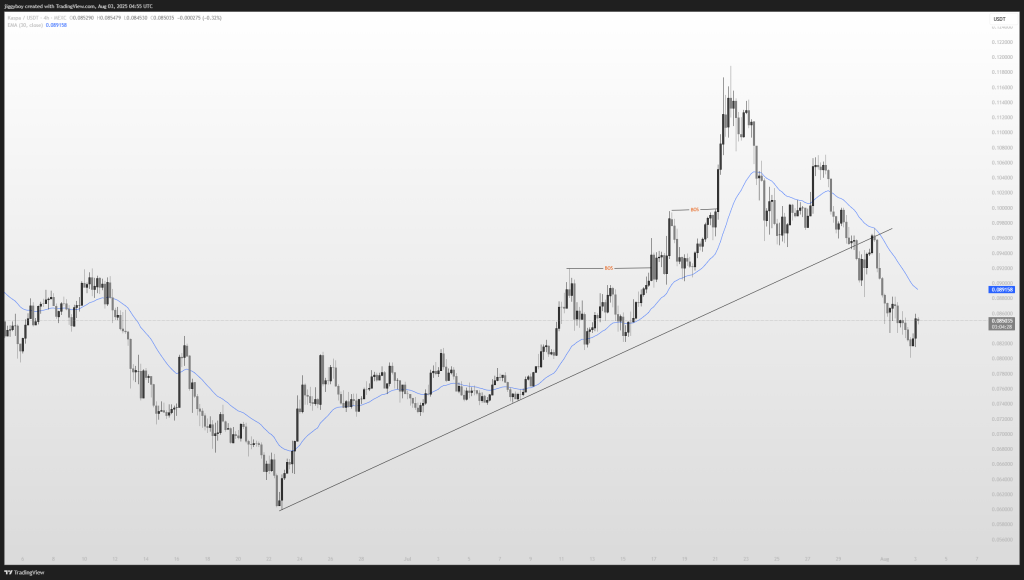
KAS price is still trading under its 30 EMA and below the broken trendline from July. That keeps the market in a cautious spot, with $0.082 acting as the current floor. If that level gives out, the next landing area could be $0.075–$0.070.
On the upside, $0.089–$0.090 is the first wall to clear. Above that, $0.095–$0.10 comes into play, and only a push past $0.10 would start to challenge the larger downtrend.
🔍 What the Kaspa Chart Is Showing
The 4H chart clearly shows that sellers have taken over since the break of the rising trendline around $0.095. Break-of-structure points at $0.11 and $0.094 confirmed that the previous rally ran out of steam.
The small bounce from $0.082 is there, but it’s tiny compared to the drop from $0.12. Bulls need to reclaim $0.09–$0.095 to ease the selling pressure. Until that happens, the token stays vulnerable to lower moves if support breaks.
📈 Technical Indicators (Hourly Timeframe)
| Indicator | Value | Signal / Interpretation |
|---|---|---|
| MACD (12,26) | 0 | Flat momentum, not fully bullish |
| ADX (14) | 37.85 | Moderate trend strength, favors buyers |
| CCI (14) | 155.58 | Strong bullish pressure, overbought risk |
| RSI (14) | 55.40 | Mild bullish momentum |
| ROC (Rate of Change) | 2.559 | Positive, showing upward movement |
| Bull/Bear Power (13) | 0.0021 | Buyers slightly stronger than sellers |
Summary: Most indicators lean bullish right now. RSI and ROC show upward pressure, and ADX backs the short-term trend. CCI is high, which hints that price might need a small cooldown before pushing higher.
🔮 Kaspa Price Prediction Scenarios
Bullish Scenario:
A move above $0.090 could open a run to $0.095–$0.10. Closing above $0.10 would finally give bulls some real momentum.
Neutral Scenario:
If $0.082 holds, KAS price may just keep moving sideways between $0.082 and $0.090 until the market picks a direction.
Bearish Scenario:
If $0.082 fails, price could slide to $0.075–$0.070, and if selling gets stronger, even $0.060 could be tested.
🧠 Wrapping Up
Kaspa price is trying to recover, but it’s still sitting below its key resistance levels. Buyers are making small moves, but they haven’t flipped the trend yet.
Today’s price action will likely stay between $0.082 and $0.090. A clean breakout above or below that range will set the tone for what comes next.
Read Also: Shiba Inu Team Reveals How High SHIB Price Can Go
Subscribe to our YouTube channel for daily crypto updates, market insights, and expert analysis.