Kaspa price has been stuck in a tight range, with momentum fading after weeks of selling pressure. The token just can’t seem to break out, and most technical signals are still pointing down.
After failing to hold above $0.11 earlier this month, KAS has slipped back into consolidation and is now hanging around $0.084.
Let’s break down today’s setup.
What you'll learn 👉
📅 What We Got Right Yesterday
In yesterday’s prediction, we highlighted $0.087 as a key level, saying that if it gave way, the price could slide toward $0.084.
That’s exactly what happened. KAS price dipped under $0.087 and tested the $0.084 area, where it’s still trading with weak momentum.
We also said the most likely move would be sideways between $0.087 and $0.092 unless volume picked up. And that’s been the case, no breakouts, no bullish push, just more range-bound action.
📊 Kaspa Daily Overview (August 20)
- Current Price: $0.08457
- 24h Change: -2.1%
- RSI (14): 42.06
Kaspa price is still moving inside a bigger range between $0.075 and $0.11. Sellers continue to keep the lid on rallies, with $0.09–$0.092 acting as near-term resistance.
🔍 What the Kaspa Chart Is Showing
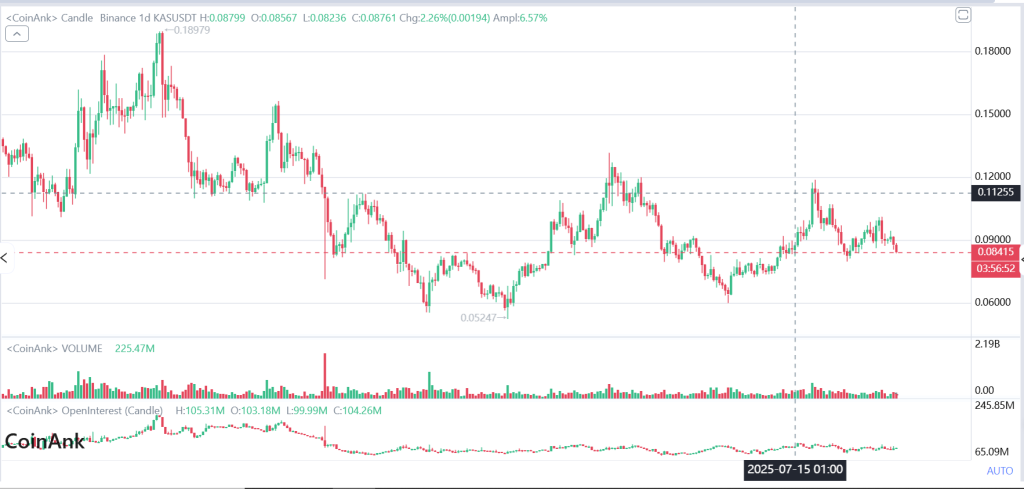
The bigger picture hasn’t changed much. Since topping near $0.19 in July, KAS price has been drifting lower with a pattern of lower highs.
The candles tell the story: long upper wicks and heavy red bodies, showing failed attempts to push higher. Volume has also dried up compared to earlier surges, which tells us buyers just aren’t stepping in with much strength.
If $0.084 breaks, the next target looks like $0.080 or even $0.075. On the flip side, if we see a bounce, $0.09–$0.10 is the next ceiling, with $0.11 still acting as a strong cap.
📈 Technical Indicators (Daily Timeframe)
| Indicator | Value | Signal |
| MACD (12,26) | 0 | Flat, leaning bearish |
| ADX (14) | 25.55 | Downtrend still has strength |
| CCI (14) | -150.92 | Oversold pressure |
| RSI (14) | 42.06 | Weak momentum |
| ROC | -3.15 | Bearish speed picking up |
| Bull/Bear Power (13) | -0.0073 | Bears slightly stronger |
Summary: all the signals are pointing bearish. RSI and CCI show weakness with oversold pressure, ADX confirms the downtrend, and there’s no real bullish divergence yet.
🔮 Kaspa Price Prediction Scenarios
Bullish:
If KAS price can get above $0.092 with real volume, it could push toward $0.095–$0.10. Clearing $0.10 opens the door to $0.11–$0.115.
Neutral:
If $0.084 holds, expect more sideways chop between $0.087 and $0.092 until volume returns.
Read Also: Kaspa Reaches Record High in Google Searches: How Far Can KAS Price Run This Cycle?
Bearish:
A close under $0.084 could send KAS toward $0.080. If sellers press harder, $0.075 is the next level to watch.
🧠 Wrapping Up
Kaspa price is still in consolidation, with sellers keeping control. The $0.084 support is the line to watch, while resistance at $0.092–$0.11 is stopping every bounce.
For today, the most likely move is more sideways action between $0.084 and $0.092, unless we get a clear break on either side.
Subscribe to our YouTube channel for daily crypto updates, market insights, and expert analysis.