Kaspa price is still stuck in that same sideways grind, holding just above its 200-day SMA but running into a wall every time it gets close to $0.10. Buyers have made a few pushes, but sellers are still guarding the $0.10–$0.105 zone like it’s their turf.
After topping out at $0.118 in July, KAS just couldn’t get past that long-term trendline, and since then it’s been bouncing around between support and resistance, now sitting at about $0.08956.
Let’s break down today’s setup.
What you'll learn 👉
📅 What We Got Right Yesterday
In yesterday’s prediction, we said a daily close above $0.10 could open up $0.105–$0.110, while a drop under $0.087 might send it down to $0.084–$0.085 or even $0.080.
That’s pretty much what happened, KAS price stayed in the neutral range, couldn’t crack $0.10, and kept trading between $0.085 and $0.10. It did dip to test the 200-day SMA but bounced back, showing that level’s still attracting buyers.
We also flagged the descending resistance line from April as the big hurdle for bulls. That’s still the case today.
📊 Kaspa Daily Overview (August 15)
- Current Price: $0.08956
- 24h Change: -9.37%
- RSI (14): 48.70 – Neutral
KAS price is holding the $0.085 support for now, but unless it breaks $0.10–$0.105 with strong volume, this range is likely to stick around a bit longer.
🔍 What the Kaspa Chart Is Showing
That descending trendline from the April high at $0.125, connected to July’s $0.118 peak, is still calling the shots. Every rally runs right into it.
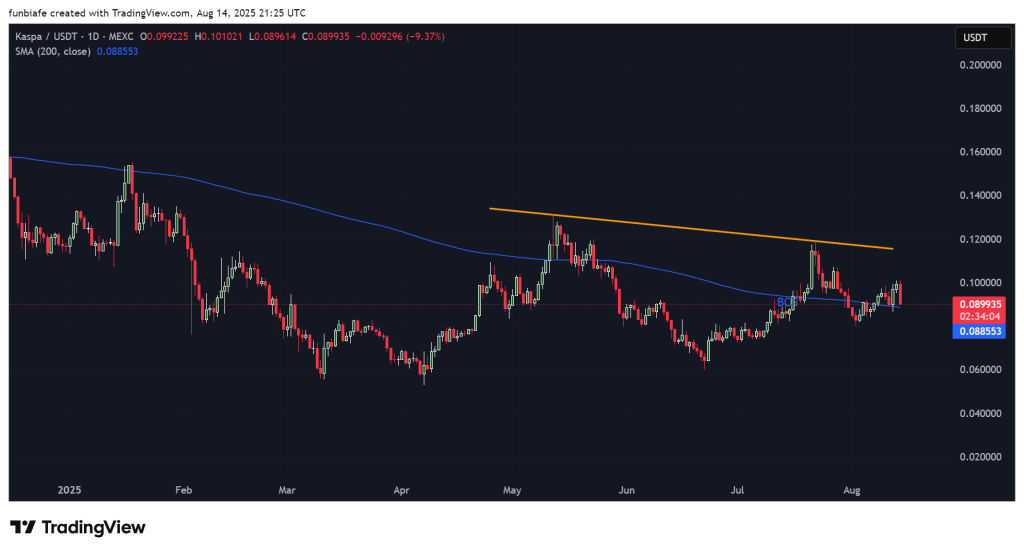
Support at $0.085 has been tested a few times since late July and so far it’s holding. Lose it, and $0.080 is back on the table. Break $0.105, and we could be looking at a run toward $0.115–$0.12.
| Indicator | Value | Signal |
| MACD | MACD | mild bullish momentum |
| ADX | 29.07 | strong but bearish trend |
| CCI | 61.90 | leaning bullish |
| RSI | 48.70 | balanced momentum |
| ROC | 2.664 | positive change |
| Bull/Bear Power | 0.0028 | slight buyer edge |
Summary: Momentum’s tilting bullish, but the trend still favors the sellers until $0.105 is cleared.
🔮 Kaspa Price Scenarios
Bullish:
Break above $0.10 could aim for $0.105–$0.110, maybe $0.118–$0.120 if momentum picks up.
Neutral:
Kaspa price is stuck between $0.085 and $0.10 until something sparks a move.
Bearish:
Close under $0.087 could lead to $0.084-$0.085, maybe $0.080.
🧠 Wrapping Up
Kaspa price is still boxed in, with $0.085 as the floor and $0.105 as the ceiling. The chart’s telling us it’s decision time soon, but until one of those levels breaks, expect more sideways chop.
Subscribe to our YouTube channel for daily crypto updates, market insights, and expert analysis.