Kaspa price has been under pressure since its July high near $0.12. Over the past few weeks, the price has steadily slipped into the $0.07–$0.08 range. Right now, it’s trading around $0.078, which is a level the market has tested before.
Earlier today, there was a sharp dip below this level, but buyers quickly stepped in and pushed it back up. That bounce suggests traders are still defending this support zone.
What you'll learn 👉
What the KAS chart is showing
The 4H chart reveals a steady downtrend since late July, with lower highs forming around $0.105, $0.10, and $0.095. At the same time, the $0.078–$0.080 range has become an important floor.
The most recent move, where KAS price briefly dropped under that support before bouncing back, looks more like a stop-hunt or liquidity grab rather than a full breakdown.
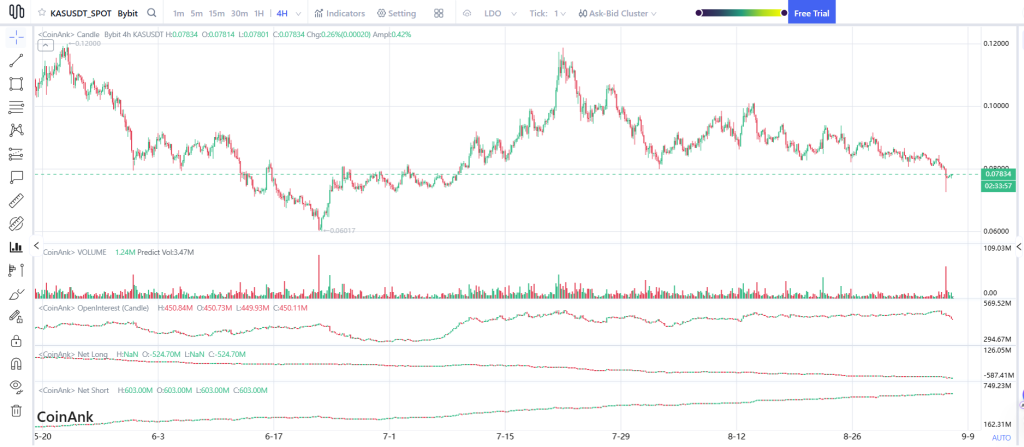
If KAS price can keep closing above $0.078–$0.080, the door opens for a recovery toward the mid-range at $0.083–$0.086. Breaking through that area could bring a test of $0.090–$0.095. But if the floor gives way, the next levels to watch would be $0.075 and then $0.070.
Market indicators
Volume has been quiet for most of August, but the latest sell-off came with a spike in trading activity. That kind of move often signals capitulation and can mark the end of a short-term downtrend.
Open interest has been declining from earlier highs and now sits around $450 million, showing that leverage is being reduced in the market.
Positioning data tells another story. Net shorts are rising while net longs remain weak. That means many traders are betting against KAS right at support.
If Kaspa price holds steady, those shorts could be forced to cover, creating the conditions for a short squeeze that pushes the price higher.
Read Also: XRP, ETH, and Even U.S. Stocks: The DEX That Lets You Trade It All
KAS price: short-term outlook for the week
For now, Kaspa looks set to trade in a range with the potential for a bounce. Provided $0.078–$0.080 is maintained, a reversal to $0.083–$0.086 is likely, and if it has any strength behind it, even $0.090–$0.095 could be tested again.
Or, if the KAS price does break down and settle below $0.078, the door is open to $0.075 or even $0.070.
In short, Kaspa chart suggests it’s at a key make-or-break level. The coming week will likely decide whether we see a relief rally or another leg lower.
Subscribe to our YouTube channel for daily crypto updates, market insights, and expert analysis.