Kaspa is around a level that matters. Crypto Bull God, a well-known analyst, said that the current price near $0.032 is right around his average long term entry point. That is not a random observation.
He is now evaluating whether to reaccumulate more, but he is honest about the uncertainty. Two scenarios are on the table. One takes the KAS price lower into a blue zone. The other breaks out to $0.05 and beyond. Both depend on what Bitcoin does next.
What you'll learn 👉
The KAS Weekly Chart Paints a Clear Picture
We had a look at the weekly chart shared by Crypto Bull, and the structure is clear. The KAS price closed the latest week at $0.032329, up 2.71% on volume of 217 million. That is a small green candle inside a much larger falling wedge pattern. The wedge has been forming for over a year, with lower highs and lower lows squeezing price toward the tip.
The 200 EMA sits way up near $0.042, which means the KAS price is trading well below its long term average. That is a bearish sign in isolation, but falling wedges are reversal patterns.
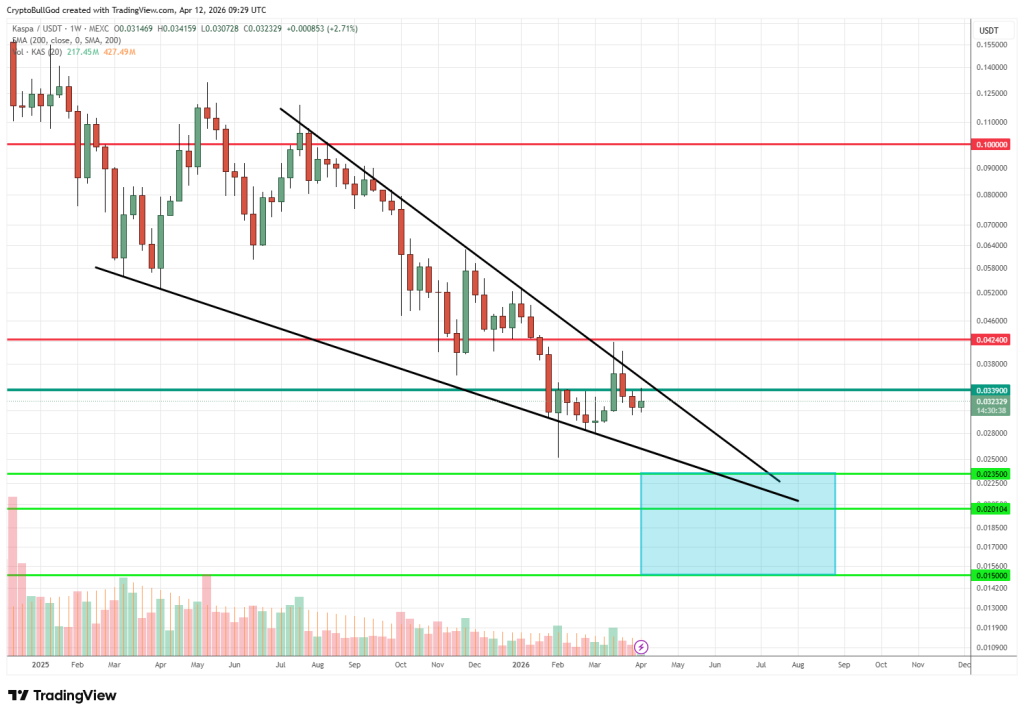
The chart also shows a blue zone marked between $0.023 and $0.015. That area has acted as support in the past. Below that, a double bottom scenario near $0.025 to $0.03 is also possible.
The KAS price is currently at $0.032, which is right above both of those zones. The analyst is watching to see whether price revisits that blue accumulation area or breaks the wedge to the upside first.
Scenario One – The Blue Zone Re Entry
The first scenario is the one Crypto Bull God has been talking about for a while. Kaspa re enters the blue zone, no matter how brief or extended. The opportunity to buy would be between $0.023 and $0.015.
For this to happen, the KAS price would need to stay inside the falling wedge pattern while Bitcoin makes its final move down to the $40,000 to $50,000 region.
The idea is that Bitcoin drives everything. If Bitcoin drops, most altcoins drop with it, including Kaspa. A move down to $0.015 would be a 50% drop from current levels. Painful, but the analyst sees it as a buying opportunity, not a disaster.
Scenario Two – The Breakout to $0.05
The second scenario is more optimistic in the short term. Kaspa breaks out of the falling wedge to the upside and heads toward $0.05 or higher. That would require Bitcoin to keep moving up instead of rolling over. In this world, everyone starts cheering for new all time highs.
But Crypto Bull God says he would stay patient even then. He would still be waiting for the Bitcoin drop described in scenario one. A breakout now would likely be followed by a double bottom later. The KAS price would go up, then come back down to test the $0.025 to $0.03 area before a real rally begins.
Read Also: Where Could Kaspa (KAS) Price Go This New Week?
Where the KAS Price Goes From Here
The KAS price is caught between these two paths. The falling wedge could break either direction. The analyst is not betting hard on one scenario. He is watching and waiting. The blue zone at $0.023 to $0.015 is the bigger discount.
The double bottom at $0.025 to $0.03 is a higher low. The breakout to $0.05 is the faster upside. Each scenario has its own risk and reward. The only thing everyone agrees on is that the KAS price is at a very interesting spot.
Subscribe to our YouTube channel for daily crypto updates, market insights, and expert analysis.