When it comes to predicting the future trajectory of a cryptocurrency like Kaspa ($KAS), technical indicators such as trend lines and Fibonacci levels can be invaluable tools.
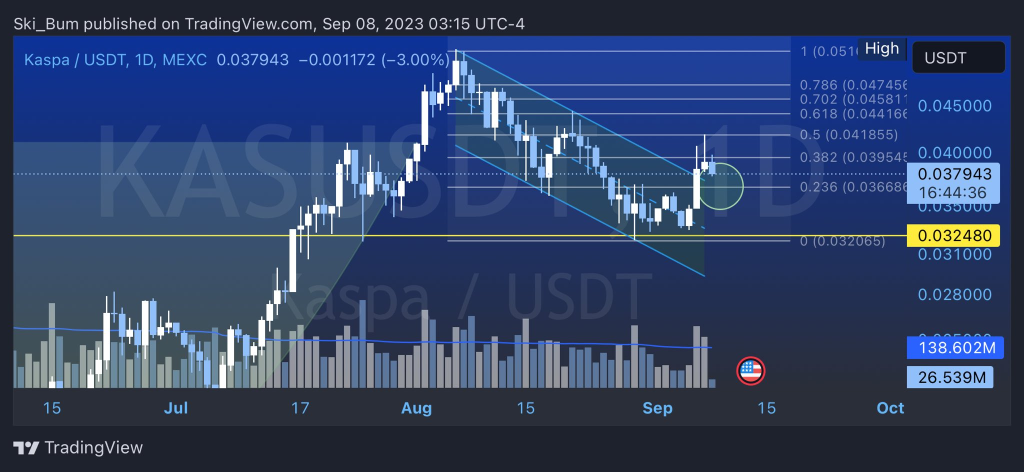
A backtest of these trend lines, particularly the 0.236 Fibonacci level, often serves as a reliable point for a bounce-back. This is especially true before the asset makes a move towards its All-Time Highs (ATHs).

What you'll learn 👉
Historical Context: The Low at .012
For instance, after Kaspa hit a low at .012, it retraced back to the 0.236 Fibonacci level. This was a clear signal for traders that the asset was “off to the races,” so to speak. It’s crucial to note that these levels are not just random numbers but are derived from mathematical ratios found in nature, which have been proven to apply to financial markets as well.
Doge2014 raises 500K in days celebrating Dogecoin. Make potentially big profits and get in on exclusive airdrop!
Show more +The crypto community is known for its extreme emotional swings, from euphoria to despair. Recently, some traders have been overly euphoric about Kaspa’s price movements, even going to the extent of mocking skeptics.
However, it’s essential to remember that what we’re witnessing could very well be an anticipated bearish retest, a phenomenon I’ve previously discussed.
For those seeking guidance, it’s vital to be unbiased and look at the levels for both bullish and bearish scenarios. If you believe that Kaspa has already bottomed out, consider the asset’s backtest of monthly support from its previous ATH as a positive indicator.
Kaspa has shown a clean Fibonacci level counting, reacting impulsively at its 0.5 fib retracement. This behavior is a strong indicator of a bullish continuation. So, if you’re an investor or a trader, keep an eye on these levels for the next leg up. However, this is not financial advice (NFA).

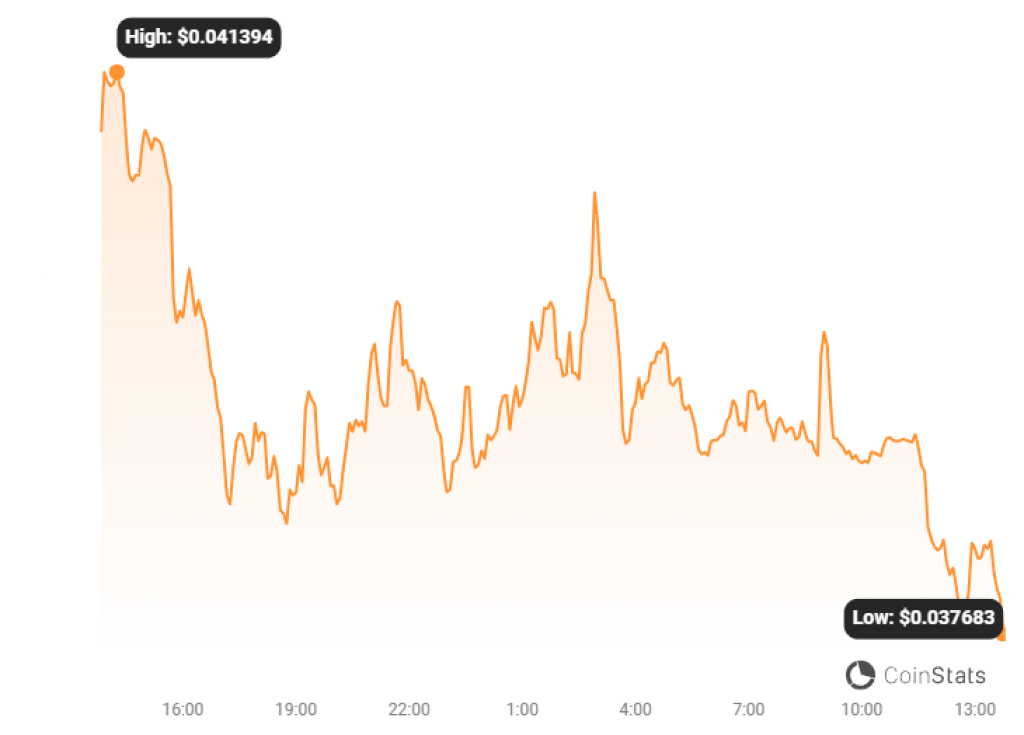
Source: CoinStats – Start using it today
The 24-Hour Price Drop: A Closer Look
According to CoinMarketCap, Kaspa’s price today stands at $0.038, with a 24-hour trading volume of $19,109,303. The asset has seen a 7.5% drop in the last 24 hours, bringing its market cap to $783,428,565. Despite this dip, it’s crucial to consider the bigger picture and long-term trends before making any investment decisions.
We recommend eToro
Wide range of assets: cryptocurrencies alongside other investment products such as stocks and ETFs.
Copy trading: allows users to copy the trades of leading traders, for free.
User-friendly: eToro’s web-based platform and mobile app are user-friendly and easy to navigate.


