Popular crypto analyst that goes by the name ‘CryptoBusy’ tweeted an updated Kaspa chart to his 200k followers on X.
He noted a ‘double bottom’ pattern on the KAS chart, so let’s find out the details. The Kaspa price is trading around $0.075 after losing 2.5% today.
What you'll learn 👉
Breaking Down the Double Bottom Pattern
CryptoBusy’s tweet highlights a potential trend reversal for Kaspa. The chart shows a double bottom pattern on the daily timeframe using Heikin Ashi candlesticks, which help smooth out price action and make trends easier to spot.
The double bottom pattern has formed with two clear price dips at nearly the same level. This is often a sign that a downtrend might be ending. What makes this more exciting is that KAS has also broken through a descending trendline that had been pushing prices down since November 2024.
The chart shows a horizontal resistance zone around $0.078-$0.08. This acts as the “neckline” of the double bottom. KAS is trading just above this level now, at around $0.07813, which suggests we might be seeing the start of a breakout.
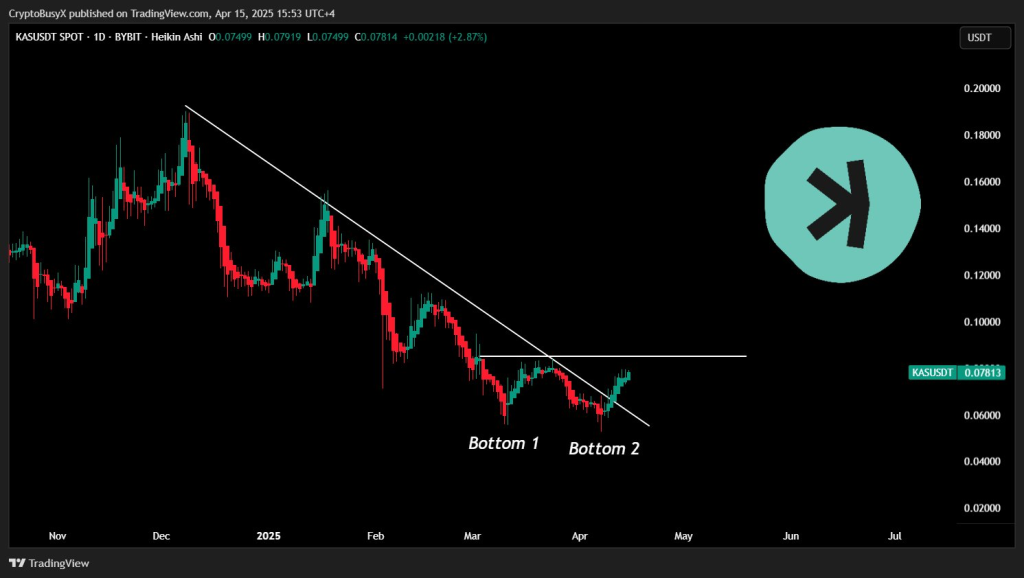
Recent candles show strong green momentum right after breaking the trendline. This is a good sign for bulls, though we can’t see the volume on this chart. Higher trading volume would make this signal more reliable.
If you’re watching KAS, keep an eye on these important price levels:
The immediate support sits between $0.066-$0.068, which is the area between the two bottoms. A stronger support level exists at $0.05, which has been a solid base during recent price consolidation.
For this bullish setup to be confirmed, KAS needs to stay above the $0.078-$0.08 neckline. If it drops back below, it might retest the previous resistance as support.
Kaspa Price Prediction
There are three possible scenarios for KAS price in the coming weeks:
In the most realistic case, if the breakout holds but moves gradually, KAS could reach $0.095-$0.10. This lines up with a key psychological level and resistance from early February. This would be about a 22-28% gain from the current price.
In a more bullish scenario with increasing volume and positive market sentiment, KAS could push to $0.11-$0.125. This area was a consolidation zone in January and would likely attract sellers again. A move to $0.12 would represent a 53% increase from current prices.
If this turns out to be a fake breakout and price falls below $0.074 again, KAS might drop back to $0.066-$0.068 to retest the double bottom support. If that fails too, it could fall back to $0.05, which has been a strong demand level historically.
Read also: How High Does Kaspa (KAS) Need to Go to Turn $10-15K Investment Into $1 Million?
What to Watch For
For traders following this setup, look for these key signals:
- A sustained close above $0.078-$0.08 on multiple daily candles would confirm the breakout.
- A retest of the breakout zone could provide an entry opportunity if the price bounces from there.
- A volume spike would make the breakout more reliable.
- If the bullish pattern plays out, watch for resistance at $0.10, $0.12-$0.14, and eventually $0.16-$0.20.
The technical picture for KAS looks promising, but remember that crypto prices don’t move in isolation. The broader market conditions and Bitcoin’s performance will also influence where Kaspa goes from here.
Subscribe to our YouTube channel for daily crypto updates, market insights, and expert analysis.

We recommend eToro
Wide range of assets: cryptocurrencies alongside other investment products such as stocks and ETFs.
Copy trading: allows users to copy the trades of leading traders, for free.
User-friendly: eToro’s web-based platform and mobile app are user-friendly and easy to navigate.